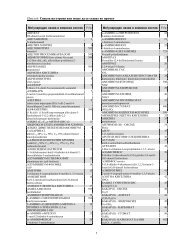
REGIONAL COOPERATION AND ECONOMIC INTEGRATION
REGIONAL COOPERATION AND ECONOMIC INTEGRATION
REGIONAL COOPERATION AND ECONOMIC INTEGRATION
- No tags were found...

Create successful ePaper yourself
Turn your PDF publications into a flip-book with our unique Google optimized e-Paper software.
to results obtained it may be noticed a certain change in explanation of total variability in<br />
different sequences only in the case of GDP and REER, while imports and openness are to<br />
be quite stable while explaining the fluctuations. Thus, the import fluctuation after the two<br />
year period are explained 18,38% by its own variance and 38,35% by the variance of the<br />
openness indicator .<br />
CONCLUSIONS<br />
Within the past decade Macedonian total exports have fallen as a percentage of world<br />
totals, while increase has been noticed in most of the sectors the country is being export<br />
concentrated. These sectors in particular are those with decreasing share into European<br />
manufacturing exports, as one of the main trading partners. As exports and productivity<br />
fall the current account deficit exposed vulnerabilities in coverage ratio and external<br />
debt. Exports are also dependent upon the REER movements, unlike imports which are<br />
responsive to the certain shifts of openness indicator. Exports explicitly show a high inertia<br />
in their movement. Put differently, exports should fall sufficiently to bring about 1,8% of<br />
the total adjustment needed per quarter until equilibrium is restored. In principal, the both<br />
sequences used to examine the influence of random shocks within the variables after the<br />
period of two years indicate higher levels of REER and real unit labor cost in explaining<br />
the total variability unlike the industrial production that remains quite stable. On the<br />
other hand, imports prove faster adjustment to the equilibrium level. Additionally, GDP<br />
and REER exhibit some changes in explanation of total variability after 8 quarters, while<br />
openness indicator is quite stabile at explaining the certain imports fluctuations.<br />
REFERENCES<br />
CEFTA-2006 TRADE <strong>COOPERATION</strong><br />
Aiginger, K. ( 1998), Unit values to signal the quality position of CEECs, OECD Proceedings,<br />
The competitiveness of transition economies.<br />
Ark Van, B. Stuwenwold, E. and Gerard, Y. (2005), Unit labour costs, productivity and<br />
international competitiveness, Research Memorandum GD-80, Groningen growth and<br />
development centre.<br />
Balassa, B. (1965), Trade Liberalization and ‘Revealed’ Comparative Advantage, Manchester<br />
School, No. 33, May.<br />
Bertola, G. and Faini, R. (1991), Import demand and non-tariff barriers: the impact of trade<br />
liberalization, Journal of Development Economics, 34, pp. 269-286.<br />
Edwards, S. (1992), Trade orientation, distortions and growth in developing countries, Journal<br />
of Development Economics, 39, July, pp. 31-57.<br />
Edwards, S. (1993), Openness, trade liberalisation and growth in developing countries,<br />
Journal of Economic Literature, 31, pp. 1358-1393.<br />
Erlat, G. and Akyuuz. O. (2001), Country concentration of Turkish exports and imports over<br />
time, Economics web institute<br />
Fagerberg, J. (1988), International competitiveness, The Economic journal, Vol. 98, No. 391,<br />
pp. 355-374<br />
145