REGIONAL COOPERATION AND ECONOMIC INTEGRATION
REGIONAL COOPERATION AND ECONOMIC INTEGRATION
REGIONAL COOPERATION AND ECONOMIC INTEGRATION
- No tags were found...
Create successful ePaper yourself
Turn your PDF publications into a flip-book with our unique Google optimized e-Paper software.
<strong>REGIONAL</strong> TRADE AGREEMENTS <strong>AND</strong> <strong>REGIONAL</strong> <strong>COOPERATION</strong><br />
where R stands for Ranking, V the index value underlying the position, H and S stand for<br />
Hungarian and Spanish position or value respectively. The minimum position is R min<br />
=50,<br />
with one exception: in the case of the ESI index Malta, Cyprus and Luxemburg are not<br />
listed in the ranking because of their small size.<br />
We have selected for international indicators to compare and link the rankings<br />
numerically. These are the following: Global Competitiveness Index (GCI) prepared<br />
by World Economic Forum, the Index of Economic Freedom (IEF) published by the<br />
Heritage Foundation, this latter has administrative and social aspects too, as well as the<br />
Environmental Sustainability Index (ESI) calculated by the Universities of Yale and<br />
Columbia and the Human Development Index (HDI) of UNDP. These indicators, when<br />
used jointly, take into consideration the economic, social and environmental aspects of<br />
competitiveness and sustainability. In addition, instead of one index they provide a more<br />
detailed image in some aggregate particular indices (World Economic Forum, 2008, The<br />
Heritage Foundation, 2008, Environmental Sustainability Index, 2008, UNDP, 2008).<br />
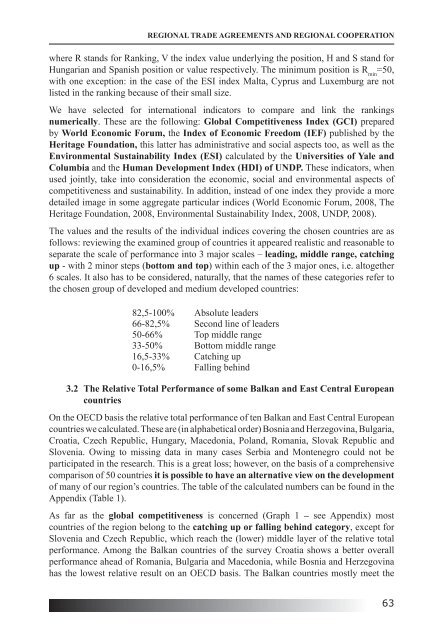
The values and the results of the individual indices covering the chosen countries are as<br />
follows: reviewing the examined group of countries it appeared realistic and reasonable to<br />
separate the scale of performance into 3 major scales – leading, middle range, catching<br />
up - with 2 minor steps (bottom and top) within each of the 3 major ones, i.e. altogether<br />
6 scales. It also has to be considered, naturally, that the names of these categories refer to<br />
the chosen group of developed and medium developed countries:<br />
82,5-100% Absolute leaders<br />
66-82,5% Second line of leaders<br />
50-66% Top middle range<br />
33-50% Bottom middle range<br />
16,5-33% Catching up<br />
0-16,5% Falling behind<br />
3.2 The Relative Total Performance of some Balkan and East Central European<br />
countries<br />
On the OECD basis the relative total performance of ten Balkan and East Central European<br />
countries we calculated. These are (in alphabetical order) Bosnia and Herzegovina, Bulgaria,<br />
Croatia, Czech Republic, Hungary, Macedonia, Poland, Romania, Slovak Republic and<br />
Slovenia. Owing to missing data in many cases Serbia and Montenegro could not be<br />
participated in the research. This is a great loss; however, on the basis of a comprehensive<br />
comparison of 50 countries it is possible to have an alternative view on the development<br />
of many of our region’s countries. The table of the calculated numbers can be found in the<br />
Appendix (Table 1).<br />
As far as the global competitiveness is concerned (Graph 1 – see Appendix) most<br />
countries of the region belong to the catching up or falling behind category, except for<br />
Slovenia and Czech Republic, which reach the (lower) middle layer of the relative total<br />
performance. Among the Balkan countries of the survey Croatia shows a better overall<br />
performance ahead of Romania, Bulgaria and Macedonia, while Bosnia and Herzegovina<br />
has the lowest relative result on an OECD basis. The Balkan countries mostly meet the<br />
63


