REGIONAL COOPERATION AND ECONOMIC INTEGRATION
REGIONAL COOPERATION AND ECONOMIC INTEGRATION
REGIONAL COOPERATION AND ECONOMIC INTEGRATION
- No tags were found...

You also want an ePaper? Increase the reach of your titles
YUMPU automatically turns print PDFs into web optimized ePapers that Google loves.
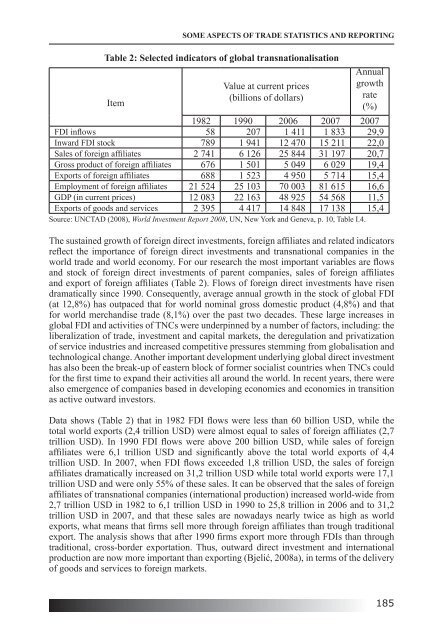
Table 2: Selected indicators of global transnationalisation<br />
Item<br />
SOME ASPECTS OF TRADE STATISTICS <strong>AND</strong> REPORTING<br />
Value at current prices<br />
(billions of dollars)<br />
Annual<br />
growth<br />
rate<br />
(%)<br />
1982 1990 2006 2007 2007<br />
FDI inflows 58 207 1 411 1 833 29,9<br />
Inward FDI stock 789 1 941 12 470 15 211 22,0<br />
Sales of foreign affiliates 2 741 6 126 25 844 31 197 20,7<br />
Gross product of foreign affiliates 676 1 501 5 049 6 029 19,4<br />
Exports of foreign affiliates 688 1 523 4 950 5 714 15,4<br />
Employment of foreign affiliates 21 524 25 103 70 003 81 615 16,6<br />
GDP (in current prices) 12 083 22 163 48 925 54 568 11,5<br />
Exports of goods and services 2 395 4 417 14 848 17 138 15,4<br />
Source: UNCTAD (2008), World Investment Report 2008, UN, New York and Geneva, p. 10, Table I.4.<br />
The sustained growth of foreign direct investments, foreign affiliates and related indicators<br />
reflect the importance of foreign direct investments and transnational companies in the<br />
world trade and world economy. For our research the most important variables are flows<br />
and stock of foreign direct investments of parent companies, sales of foreign affiliates<br />
and export of foreign affiliates (Table 2). Flows of foreign direct investments have risen<br />
dramatically since 1990. Consequently, average annual growth in the stock of global FDI<br />
(at 12,8%) has outpaced that for world nominal gross domestic product (4,8%) and that<br />
for world merchandise trade (8,1%) over the past two decades. These large increases in<br />
global FDI and activities of TNCs were underpinned by a number of factors, including: the<br />
liberalization of trade, investment and capital markets, the deregulation and privatization<br />
of service industries and increased competitive pressures stemming from globalisation and<br />
technological change. Another important development underlying global direct investment<br />
has also been the break-up of eastern block of former socialist countries when TNCs could<br />
for the first time to expand their activities all around the world. In recent years, there were<br />
also emergence of companies based in developing economies and economies in transition<br />
as active outward investors.<br />
Data shows (Table 2) that in 1982 FDI flows were less than 60 billion USD, while the<br />
total world exports (2,4 trillion USD) were almost equal to sales of foreign affiliates (2,7<br />
trillion USD). In 1990 FDI flows were above 200 billion USD, while sales of foreign<br />
affiliates were 6,1 trillion USD and significantly above the total world exports of 4,4<br />
trillion USD. In 2007, when FDI flows exceeded 1,8 trillion USD, the sales of foreign<br />
affiliates dramatically increased on 31,2 trillion USD while total world exports were 17,1<br />
trillion USD and were only 55% of these sales. It can be observed that the sales of foreign<br />
affiliates of transnational companies (international production) increased world-wide from<br />
2,7 trillion USD in 1982 to 6,1 trillion USD in 1990 to 25,8 trillion in 2006 and to 31,2<br />
trillion USD in 2007, and that these sales are nowadays nearly twice as high as world<br />
exports, what means that firms sell more through foreign affiliates than trough traditional<br />
export. The analysis shows that after 1990 firms export more through FDIs than through<br />
traditional, cross-border exportation. Thus, outward direct investment and international<br />
production are now more important than exporting (Bjelić, 2008a), in terms of the delivery<br />
of goods and services to foreign markets.<br />
185