REGIONAL COOPERATION AND ECONOMIC INTEGRATION
REGIONAL COOPERATION AND ECONOMIC INTEGRATION
REGIONAL COOPERATION AND ECONOMIC INTEGRATION
- No tags were found...

Create successful ePaper yourself
Turn your PDF publications into a flip-book with our unique Google optimized e-Paper software.
PART V:<br />
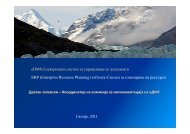
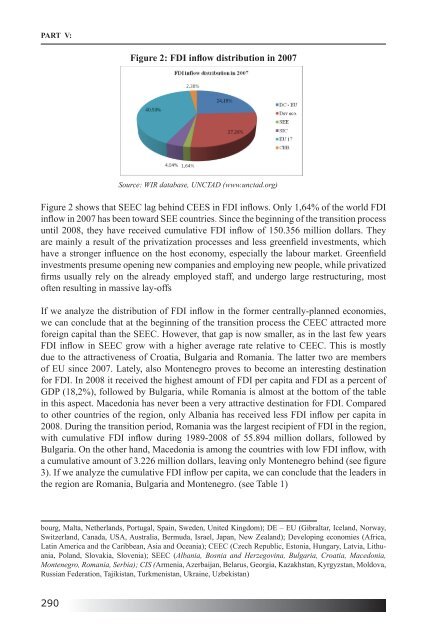
Figure 2: FDI inflow distribution in 2007<br />
Source: WIR database, UNCTAD (www.unctad.org)<br />
Figure 2 shows that SEEC lag behind CEES in FDI inflows. Only 1,64% of the world FDI<br />
inflow in 2007 has been toward SEE countries. Since the beginning of the transition process<br />
until 2008, they have received cumulative FDI inflow of 150.356 million dollars. They<br />
are mainly a result of the privatization processes and less greenfield investments, which<br />
have a stronger influence on the host economy, especially the labour market. Greenfield<br />
investments presume opening new companies and employing new people, while privatized<br />
firms usually rely on the already employed staff, and undergo large restructuring, most<br />
often resulting in massive lay-offs<br />
If we analyze the distribution of FDI inflow in the former centrally-planned economies,<br />
we can conclude that at the beginning of the transition process the CEEC attracted more<br />
foreign capital than the SEEC. However, that gap is now smaller, as in the last few years<br />
FDI inflow in SEEC grow with a higher average rate relative to CEEC. This is mostly<br />
due to the attractiveness of Croatia, Bulgaria and Romania. The latter two are members<br />
of EU since 2007. Lately, also Montenegro proves to become an interesting destination<br />
for FDI. In 2008 it received the highest amount of FDI per capita and FDI as a percent of<br />
GDP (18,2%), followed by Bulgaria, while Romania is almost at the bottom of the table<br />
in this aspect. Macedonia has never been a very attractive destination for FDI. Compared<br />
to other countries of the region, only Albania has received less FDI inflow per capita in<br />
2008. During the transition period, Romania was the largest recipient of FDI in the region,<br />
with cumulative FDI inflow during 1989-2008 of 55.894 million dollars, followed by<br />
Bulgaria. On the other hand, Macedonia is among the countries with low FDI inflow, with<br />
a cumulative amount of 3.226 million dollars, leaving only Montenegro behind (see figure<br />
3). If we analyze the cumulative FDI inflow per capita, we can conclude that the leaders in<br />
the region are Romania, Bulgaria and Montenegro. (see Table 1)<br />
bourg, Malta, Netherlands, Portugal, Spain, Sweden, United Kingdom); DE – EU (Gibraltar, Iceland, Norway,<br />
Switzerland, Canada, USA, Australia, Bermuda, Israel, Japan, New Zealand); Developing economies (Africa,<br />
Latin America and the Caribbean, Asia and Oceania); CEEC (Czech Republic, Estonia, Hungary, Latvia, Lithuania,<br />
Poland, Slovakia, Slovenia); SEEC (Albania, Bosnia and Herzegovina, Bulgaria, Croatia, Macedonia,<br />
Montenegro, Romania, Serbia); CIS (Armenia, Azerbaijan, Belarus, Georgia, Kazakhstan, Kyrgyzstan, Moldova,<br />
Russian Federation, Tajikistan, Turkmenistan, Ukraine, Uzbekistan)<br />
290