- Page 1 and 2: Proceedings from the Third Internat
- Page 3 and 4: © All rights reserved. No part of
- Page 5 and 6: Skopje, 15.10.2009 Dear Colleagues,
- Page 8 and 9: CONTENTS: PART I: REGIONAL TRADE AG
- Page 10: Ph.D. Sanja Đurđić THE RULE OF L
- Page 13 and 14: PART I: Greater openness means fier
- Page 15 and 16: PART I: the past never experienced
- Page 17 and 18: PART I: Nowadays such actions will
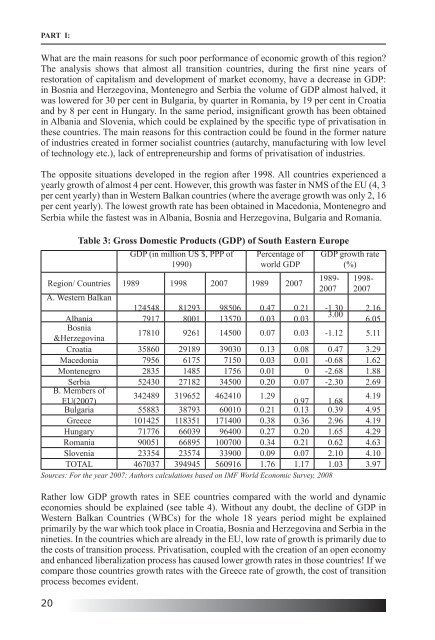
- Page 19 and 20: PART I: ratio could ultimately rais
- Page 21 and 22: PART I: 3. CEFTA regional cooperati
- Page 23 and 24: PART I: any other type of economic
- Page 25 and 26: PART I: including Kosovo, who is de
- Page 27 and 28: PART I: Rodrik, Dani. (1999), The N
- Page 29: PART I: The paper examines how West
- Page 33 and 34: PART I: EU growth rates and a sign
- Page 35 and 36: PART I: only a limited portion of t
- Page 37 and 38: PART I: on a larger trade deficit;
- Page 39 and 40: PART I: and world trade in goods an
- Page 42 and 43: REGIONAL TRADE AGREEMENTS AND REGIO
- Page 44 and 45: REGIONAL TRADE AGREEMENTS AND REGIO
- Page 46 and 47: REGIONAL TRADE AGREEMENTS AND REGIO
- Page 48 and 49: REGIONAL TRADE AGREEMENTS AND REGIO
- Page 50 and 51: REGIONAL TRADE AGREEMENTS AND REGIO
- Page 52: REGIONAL TRADE AGREEMENTS AND REGIO
- Page 55 and 56: PART I: was developed especially fo
- Page 57 and 58: PART I: 2. Theoretical background,
- Page 59 and 60: PART I: focus on the way in which t
- Page 61 and 62: PART I: of private incomes by addin
- Page 63 and 64: PART I: the GDP per capita: the 53.
- Page 65 and 66: PART I: received EU-transfers, but
- Page 68 and 69: Dr Márta Zádor, PhD Deputy Genera
- Page 70 and 71: REGIONAL TRADE AGREEMENTS AND REGIO
- Page 72 and 73: REGIONAL TRADE AGREEMENTS AND REGIO
- Page 74 and 75: REGIONAL TRADE AGREEMENTS AND REGIO
- Page 76 and 77: Macedonia REGIONAL TRADE AGREEMENTS
- Page 78 and 79: REGIONAL TRADE AGREEMENTS AND REGIO
- Page 80 and 81:
REGIONAL TRADE AGREEMENTS AND REGIO
- Page 82 and 83:
REGIONAL TRADE AGREEMENTS AND REGIO
- Page 84 and 85:
REGIONAL TRADE AGREEMENTS AND REGIO
- Page 86 and 87:
Goran Buturac, Ph.D., Research Fell
- Page 88 and 89:
REGIONAL TRADE AGREEMENTS AND REGIO
- Page 90 and 91:
c in total exports of country a in
- Page 92 and 93:
2.3. Comparative advantages REGIONA
- Page 94 and 95:
REGIONAL TRADE AGREEMENTS AND REGIO
- Page 96 and 97:
REGIONAL TRADE AGREEMENTS AND REGIO
- Page 98 and 99:
2.6. Export similarities The paper
- Page 100:
REGIONAL TRADE AGREEMENTS AND REGIO
- Page 103 and 104:
PART II: INTRODUCTION CEFTA-2006 is
- Page 105 and 106:
PART II: Agreement for Modification
- Page 107 and 108:
PART II: only provide temporary rep
- Page 109 and 110:
PART II: The Leaders of the Group o
- Page 111 and 112:
PART II: messages over the past yea
- Page 113 and 114:
PART II: INTRODUCTION Central Europ
- Page 115 and 116:
PART II: Table 1: Gross domestic pr
- Page 117 and 118:
PART II: Figure 3: Distribution of
- Page 119 and 120:
PART II: Table 6: Countries of West
- Page 121 and 122:
PART II: Adriatic gas pipeline is c
- Page 123 and 124:
PART II: Total Croatian export to t
- Page 125 and 126:
PART II: CIA - The World Bank Factb
- Page 128 and 129:
CEFTA-2006 TRADE COOPERATION Sanja
- Page 130 and 131:
the implementation of the protocol
- Page 132 and 133:
CEFTA-2006 TRADE COOPERATION in the
- Page 134 and 135:
The major foreign trade partners in
- Page 136:
Integration, Vol. 26, No. 3, 309-33
- Page 139 and 140:
PART II: divisive, as well as mainl
- Page 141 and 142:
PART II: of time. During the transi
- Page 143 and 144:
PART II: been recovered from 2004 o
- Page 145 and 146:
PART II: diversified structure as c
- Page 147 and 148:
PART II: VAR and to test if one may
- Page 149 and 150:
PART II: VAR since the test for coi
- Page 151 and 152:
PART II: coefficient sign) but mode
- Page 153 and 154:
PART II: elasticity. The seasonal f
- Page 155 and 156:
PART II: GDP” that has been runni
- Page 157 and 158:
PART II: Faini, R., Pritchett, L. a
- Page 159 and 160:
PART II: pleasant. The expectations
- Page 161 and 162:
PART II: Table 3: Regional trade ex
- Page 163 and 164:
PART II: In order to bring to an en
- Page 165 and 166:
PART II: stimulated the growth rate
- Page 168 and 169:
CEFTA-2006 TRADE COOPERATION Irena
- Page 170 and 171:
CEFTA-2006 TRADE COOPERATION within
- Page 172 and 173:
Table 2: Data on exports of agricul
- Page 174 and 175:
CEFTA-2006 TRADE COOPERATION 3.1. T
- Page 176 and 177:
Macedonian export of non-agricultur
- Page 178 and 179:
is 37.1% of the total Serbian trade
- Page 180:
CEFTA-2006 TRADE COOPERATION na CEF
- Page 183 and 184:
PART II: countries in the Region, a
- Page 185 and 186:
PART II: becoming wealthier consume
- Page 187 and 188:
PART II: versa for Croatia; for Mac
- Page 189 and 190:
PART II: Table 5: Exports of the Re
- Page 191 and 192:
PART II: Commission of the European
- Page 193 and 194:
PART III: Serbia, Macedonia and man
- Page 195 and 196:
PART III: of TNCs have changed the
- Page 197 and 198:
PART III: 3. Foundations of the new
- Page 199 and 200:
PART III: modes of supply, FATS cor
- Page 201 and 202:
PART III: enterprise (affiliate). U
- Page 203 and 204:
PART III: REFERENCES Bjelić, Predr
- Page 205 and 206:
PART III: requirement for compulsor
- Page 207 and 208:
PART III: Companies prepare and pre
- Page 209 and 210:
PART III: it refers to adjusting of
- Page 211 and 212:
PART III: presentation of assets, l
- Page 214 and 215:
SOME ASPECTS OF TRADE STATISTICS AN
- Page 216 and 217:
their mass and inversely proportion
- Page 218 and 219:
Peri specifications in log-log spac
- Page 220 and 221:
orn population, is less reliable an
- Page 222 and 223:
SOME ASPECTS OF TRADE STATISTICS AN
- Page 224:
Weltwirtschaftliches Archiv, 90(01)
- Page 227 and 228:
PART IV: INTRODUCTION The manufactu
- Page 229 and 230:
PART IV: 12 Figure 2: Main developm
- Page 231 and 232:
PART IV: Firms’ characteristics F
- Page 233 and 234:
PART IV: 3.2. Measurement and data
- Page 235 and 236:
PART IV: high and high technologica
- Page 237 and 238:
PART IV: study. Firstly, companies
- Page 239 and 240:
PART IV: and Consumption Studies, U
- Page 241 and 242:
PART IV: medium-sized enterprises,
- Page 243 and 244:
PART IV: Balkan transition economie
- Page 245 and 246:
PART IV: evidence that human capita
- Page 247 and 248:
PART IV: of involving Serbia in a u
- Page 249 and 250:
PART IV: REFERENCES Arandarenko, M.
- Page 252 and 253:
CEFTA-2006 AND ANHANCING COMPETITIV
- Page 254 and 255:
CEFTA-2006 AND ANHANCING COMPETITIV
- Page 256 and 257:
CEFTA-2006 AND ANHANCING COMPETITIV
- Page 258 and 259:
CEFTA-2006 AND ANHANCING COMPETITIV
- Page 260:
CEFTA-2006 AND ANHANCING COMPETITIV
- Page 263 and 264:
PART IV: INTRODUCTION Air transport
- Page 265 and 266:
PART IV: 2. Air transport market Ge
- Page 267 and 268:
PART IV: Finally, it is necessary t
- Page 269 and 270:
PART IV: Figure 2: PSO routes conne
- Page 271 and 272:
PART IV: 2012), and 9% lower in the
- Page 273 and 274:
PART IV: b) Second phase from 2011
- Page 275 and 276:
PART IV: IATA Passenger Forecast (2
- Page 277 and 278:
PART IV: determined by legal rules
- Page 279 and 280:
PART IV: Congress in 1985. As a con
- Page 281 and 282:
PART IV: 4. The rule of law and ind
- Page 283 and 284:
PART IV: the establishment of the r
- Page 285 and 286:
PART IV: REFERENCES Barro, R. (1991
- Page 287 and 288:
PART V: the association process ear
- Page 289 and 290:
PART V: Figure 3: EU FDI outward fl
- Page 291 and 292:
PART V: (macroeconomic stability an
- Page 293 and 294:
PART V: FDIPC- logarithm value of t
- Page 295 and 296:
PART V: DIST shows that if the dist
- Page 297 and 298:
PART V: University Press. Deichmann
- Page 299 and 300:
PART V: developing countries, where
- Page 301 and 302:
PART V: Figure 2: FDI inflow distri
- Page 303 and 304:
PART V: The economic literature usu
- Page 305 and 306:
PART V: The regression equation, wi
- Page 307 and 308:
PART V: Table 1. Determinants of FD
- Page 309 and 310:
PART V: The key determinants that w
- Page 311 and 312:
PART V: REFERENCES Liebscher, K. (2
- Page 313 and 314:
PART V: INTRODUCTION In the conditi
- Page 315 and 316:
PART V: from government regarding a
- Page 317 and 318:
PART V: 306 3.1. Comparative analys
- Page 319 and 320:
PART V: are sufficiently developed.
- Page 321 and 322:
PART V: monopolistic companies is e
- Page 323 and 324:
PART V: Savić Lj., (2008.), Inostr
- Page 325 and 326:
PART V: abandoned CEFTA membership)
- Page 327 and 328:
PART V: Figure 1: FDI in selected c
- Page 329 and 330:
PART V: 318 Table 3: Balance of pay
- Page 331 and 332:
PART V: come true if stable politic
- Page 333 and 334:
PART V: The task of the effective u
- Page 335 and 336:
PART V: Cooperation between the pub
- Page 337 and 338:
PART V: needs of Serbia and in that
- Page 339 and 340:
PART V: conventional production and
- Page 341 and 342:
PART V: REFERENCES Bandiera, O., Ca
- Page 343 and 344:
PART V: stability and macroeconomic
- Page 345 and 346:
PART V: By economic activity, the m
- Page 347 and 348:
PART V: Table 3: Exports and import
- Page 349 and 350:
PART V: In the last years, a series
- Page 351 and 352:
PART V: Figure 4: Balance of paymen
- Page 353 and 354:
PART V: because the level of per ca