E N S W - United Nations Development Programme
E N S W - United Nations Development Programme
E N S W - United Nations Development Programme

Create successful ePaper yourself
Turn your PDF publications into a flip-book with our unique Google optimized e-Paper software.
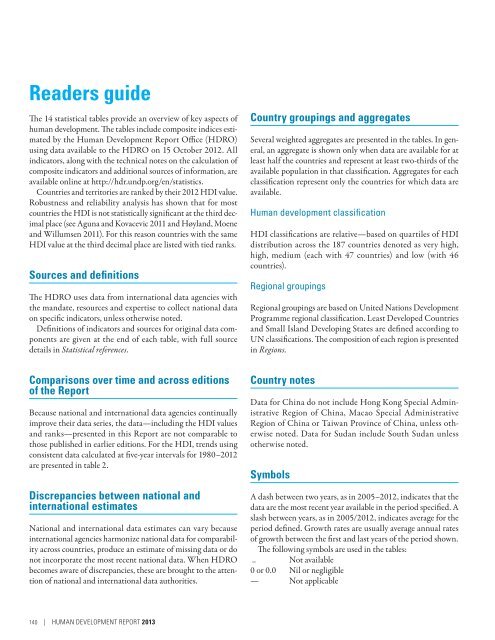
Readers guide<br />
The 14 statistical tables provide an overview of key aspects of<br />
human development. The tables include composite indices estimated<br />
by the Human <strong>Development</strong> Report Office (HDRO)<br />
using data available to the HDRO on 15 October 2012. All<br />
indicators, along with the technical notes on the calculation of<br />
composite indicators and additional sources of information, are<br />
available online at http://hdr.undp.org/en/statistics.<br />
Countries and territories are ranked by their 2012 HDI value.<br />
Robustness and reliability analysis has shown that for most<br />
countries the HDI is not statistically significant at the third decimal<br />
place (see Aguna and Kovacevic 2011 and Høyland, Moene<br />
and Willumsen 2011). For this reason countries with the same<br />
HDI value at the third decimal place are listed with tied ranks.<br />
Sources and definitions<br />
The HDRO uses data from international data agencies with<br />
the mandate, resources and expertise to collect national data<br />
on specific indicators, unless otherwise noted.<br />
Definitions of indicators and sources for original data components<br />
are given at the end of each table, with full source<br />
details in Statistical references.<br />
Comparisons over time and across editions<br />
of the Report<br />
Because national and international data agencies continually<br />
improve their data series, the data— including the HDI values<br />
and ranks— presented in this Report are not comparable to<br />
those published in earlier editions. For the HDI, trends using<br />
consistent data calculated at five-year intervals for 1980–2012<br />
are presented in table 2.<br />
Discrepancies between national and<br />
international estimates<br />
National and international data estimates can vary because<br />
international agencies harmonize national data for comparability<br />
across countries, produce an estimate of missing data or do<br />
not incorporate the most recent national data. When HDRO<br />
becomes aware of discrepancies, these are brought to the attention<br />
of national and international data authorities.<br />
Country groupings and aggregates<br />
Several weighted aggregates are presented in the tables. In general,<br />
an aggregate is shown only when data are available for at<br />
least half the countries and represent at least two-thirds of the<br />
available population in that classification. Aggregates for each<br />
classification represent only the countries for which data are<br />
available.<br />
Human development classification<br />
HDI classifications are relative—based on quartiles of HDI<br />
distribution across the 187 countries denoted as very high,<br />
high, medium (each with 47 countries) and low (with 46<br />
countries).<br />
Regional groupings<br />
Regional groupings are based on <strong>United</strong> <strong>Nations</strong> <strong>Development</strong><br />
<strong>Programme</strong> regional classification. Least Developed Countries<br />
and Small Island Developing States are defined according to<br />
UN classifications. The composition of each region is presented<br />
in Regions.<br />
Country notes<br />
Data for China do not include Hong Kong Special Administrative<br />
Region of China, Macao Special Administrative<br />
Region of China or Taiwan Province of China, unless otherwise<br />
noted. Data for Sudan include South Sudan unless<br />
otherwise noted.<br />
Symbols<br />
A dash between two years, as in 2005–2012, indicates that the<br />
data are the most recent year available in the period specified. A<br />
slash between years, as in 2005/2012, indicates average for the<br />
period defined. Growth rates are usually average annual rates<br />
of growth between the first and last years of the period shown.<br />
The following symbols are used in the tables:<br />
.. Not available<br />
0 or 0.0 Nil or negligible<br />
— Not applicable<br />
140 | Human <strong>Development</strong> Report 2013