E N S W - United Nations Development Programme
E N S W - United Nations Development Programme
E N S W - United Nations Development Programme

You also want an ePaper? Increase the reach of your titles
YUMPU automatically turns print PDFs into web optimized ePapers that Google loves.
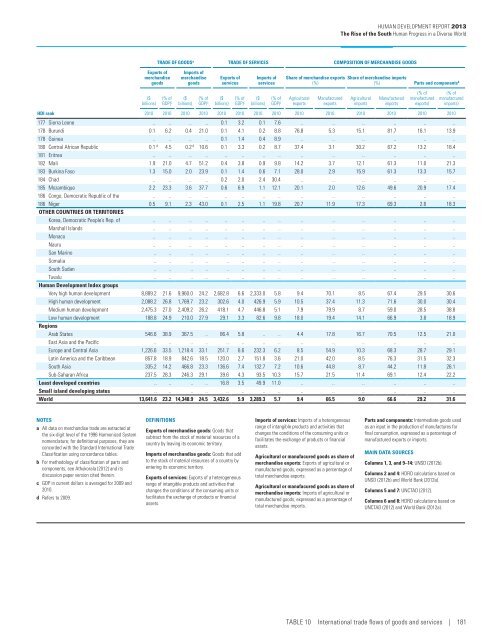
Human <strong>Development</strong> Report 2013<br />
The Rise of the South Human Progress in a Diverse World<br />
TRADE OF GOODS a TRADE OF SERVICES COMPOSITION OF MERCHANDISE GOODS<br />
Exports of<br />
merchandise<br />
goods<br />
Imports of<br />
merchandise<br />
goods<br />
Exports of<br />
services<br />
Imports of<br />
services<br />
Share of merchandise exports<br />
(%)<br />
Share of merchandise imports<br />
(%) Parts and components b<br />
($<br />
billions)<br />
(% of ($<br />
GDP) c billions)<br />
(% of ($<br />
GDP) c billions)<br />
(% of ($<br />
GDP) c billions)<br />
(% of<br />
GDP) c<br />
Agricultural<br />
exports<br />
Manufactured<br />
exports<br />
Agricultural<br />
imports<br />
Manufactured<br />
imports<br />
(% of<br />
manufactured<br />
exports)<br />
(% of<br />
manufactured<br />
imports)<br />
HDI rank 2010 2010 2010 2010 2010 2010 2010 2010 2010 2010 2010 2010 2010 2010<br />
177 Sierra Leone .. .. .. .. 0.1 3.2 0.1 7.6 .. .. .. .. .. ..<br />
178 Burundi 0.1 6.2 0.4 21.0 0.1 4.1 0.2 8.8 76.8 5.3 15.1 81.7 16.1 13.9<br />
178 Guinea .. .. .. .. 0.1 1.4 0.4 8.9 .. .. .. .. .. ..<br />
180 Central African Republic 0.1 d 4.5 0.2 d 10.6 0.1 3.3 0.2 8.7 37.4 3.1 30.2 67.2 13.2 18.4<br />
181 Eritrea .. .. .. .. .. .. .. .. .. .. .. .. .. ..<br />
182 Mali 1.9 21.0 4.7 51.2 0.4 3.8 0.9 9.8 14.2 3.7 12.1 61.3 11.0 21.3<br />
183 Burkina Faso 1.3 15.0 2.0 23.9 0.1 1.4 0.6 7.1 28.0 2.9 15.9 61.3 13.3 15.7<br />
184 Chad .. .. .. .. 0.2 2.0 2.4 30.4 .. .. .. .. .. ..<br />
185 Mozambique 2.2 23.3 3.6 37.7 0.6 6.9 1.1 12.1 20.1 2.0 12.6 49.6 20.9 17.4<br />
186 Congo, Democratic Republic of the .. .. .. .. .. .. .. .. .. .. .. .. .. ..<br />
186 Niger 0.5 9.1 2.3 43.0 0.1 2.5 1.1 19.8 20.7 11.9 17.3 69.3 2.6 18.3<br />
Other countries or territories<br />
Korea, Democratic People’s Rep. of .. .. .. .. .. .. .. .. .. .. .. .. .. ..<br />
Marshall Islands .. .. .. .. .. .. .. .. .. .. .. .. .. ..<br />
Monaco .. .. .. .. .. .. .. .. .. .. .. .. .. ..<br />
Nauru .. .. .. .. .. .. .. .. .. .. .. .. .. ..<br />
San Marino .. .. .. .. .. .. .. .. .. .. .. .. .. ..<br />
Somalia .. .. .. .. .. .. .. .. .. .. .. .. .. ..<br />
South Sudan .. .. .. .. .. .. .. .. .. .. .. .. .. ..<br />
Tuvalu .. .. .. .. .. .. .. .. .. .. .. .. .. ..<br />
Human <strong>Development</strong> Index groups<br />
Very high human development 8,889.2 21.6 9,960.0 24.2 2,682.8 6.6 2,333.0 5.8 9.4 70.1 8.5 67.4 29.5 30.6<br />
High human development 2,088.2 26.8 1,769.7 23.2 302.6 4.0 426.9 5.9 10.5 37.4 11.3 71.6 30.0 30.4<br />
Medium human development 2,475.3 27.0 2,409.2 26.2 418.1 4.7 446.8 5.1 7.9 79.9 8.7 59.0 28.5 38.8<br />
Low human development 188.8 24.9 210.0 27.9 29.1 3.3 82.6 9.8 18.0 19.4 14.1 66.9 3.8 18.9<br />
Regions<br />
Arab States 546.6 38.9 367.5 .. 86.4 5.8 .. .. 4.4 17.8 16.7 70.5 12.5 21.0<br />
East Asia and the Pacific .. .. .. .. .. .. .. .. .. .. .. .. .. ..<br />
Europe and Central Asia 1,226.6 33.5 1,218.4 33.1 251.7 6.6 232.3 6.2 8.5 54.9 10.3 68.3 28.7 29.1<br />
Latin America and the Caribbean 857.8 18.9 842.6 18.5 120.0 2.7 151.8 3.6 21.0 42.0 8.5 76.3 31.5 32.3<br />
South Asia 335.2 14.2 466.8 23.3 136.6 7.4 132.7 7.2 10.6 44.8 8.7 44.2 11.8 26.1<br />
Sub-Saharan Africa 237.5 28.3 246.3 29.1 39.6 4.3 93.5 10.3 15.7 21.5 11.4 69.1 12.4 22.2<br />
Least developed countries .. .. .. .. 16.8 3.5 49.9 11.0 .. .. .. .. .. ..<br />
Small island developing states .. .. .. .. .. .. .. .. .. .. .. .. .. ..<br />
World 13,641.6 23.2 14,348.9 24.5 3,432.6 5.9 3,289.3 5.7 9.4 66.5 9.0 66.6 29.2 31.6<br />
NOTES<br />
a All data on merchandise trade are extracted at<br />
the six-digit level of the 1996 Harmonized System<br />
nomenclature; for definitional purposes, they are<br />
concorded with the Standard International Trade<br />
Classification using concordance tables.<br />
b For methodology of classification of parts and<br />
components, see Athukorala (2012) and its<br />
discussion paper version cited therein.<br />
c GDP in current dollars is averaged for 2009 and<br />
2010.<br />
d Refers to 2009.<br />
DEFINITIONS<br />
Exports of merchandise goods: Goods that<br />
subtract from the stock of material resources of a<br />
country by leaving its economic territory.<br />
Imports of merchandise goods: Goods that add<br />
to the stock of material resources of a country by<br />
entering its economic territory.<br />
Exports of services: Exports of a heterogeneous<br />
range of intangible products and activities that<br />
changes the conditions of the consuming units or<br />
facilitates the exchange of products or financial<br />
assets.<br />
Imports of services: Imports of a heterogeneous<br />
range of intangible products and activities that<br />
changes the conditions of the consuming units or<br />
facilitates the exchange of products or financial<br />
assets.<br />
Agricultural or manufacured goods as share of<br />
merchandise exports: Exports of agricultural or<br />
manufactured goods, expressed as a percentage of<br />
total merchandise exports.<br />
Agricultural or manufacured goods as share of<br />
merchandise imports: Imports of agricultural or<br />
manufactured goods, expressed as a percentage of<br />
total merchandise imports.<br />
Parts and components: Intermediate goods used<br />
as an input in the production of manufactures for<br />
final consumption, expressed as a percentage of<br />
manufactured exports or imports.<br />
MAIN DATA SOURCES<br />
Columns 1, 3, and 9–14: UNSD (2012b).<br />
Columns 2 and 4: HDRO calculations based on<br />
UNSD (2012b) and World Bank (2012a).<br />
Columns 5 and 7: UNCTAD (2012).<br />
Columns 6 and 8: HDRO calculations based on<br />
UNCTAD (2012) and World Bank (2012a).<br />
Table 10 International trade flows of goods and services | 181