E N S W - United Nations Development Programme
E N S W - United Nations Development Programme
E N S W - United Nations Development Programme

Create successful ePaper yourself
Turn your PDF publications into a flip-book with our unique Google optimized e-Paper software.
Box 1.4<br />
Subjective indicators of well-being: increased acceptance in thinking and policy<br />
Interest in using subjective data to measure well-being and human progress<br />
and to inform public policy has grown in recent years. 1 In the <strong>United</strong><br />
Kingdom, the government committed itself to explore the use of subjective<br />
indicators of well-being, as suggested by Stiglitz, Sen and Fitoussi (2009).<br />
Bhutan has integrated the subindicators that constitute the Gross National<br />
Happiness Index into its public policy measures. Subjective data can complement<br />
but not substitute for objective data.<br />
Kahneman and Krueger (2006) lay the analytical basis for measuring<br />
subjective well-being on the fact that people often depart from the standards<br />
of the “rational economic agent”. Making inconsistent choices, not updating<br />
beliefs in the light of new information, desisting from gainful exchanges:<br />
all violate the assumption of rationality that underlies the translation of observed<br />
behaviour into a theory of revealed preferences in economics. If the<br />
assumed link between observed data and actual preferences is tenuous, the<br />
case for relying exclusively on objective data is weakened, and there exists<br />
a greater case for using subjective data as well.<br />
Stiglitz, Sen and Fitoussi (2009) adopt subjective well-being as one of<br />
their three conceptual approaches to measuring quality of life. They point<br />
out that the approach has strong links to the utilitarian tradition but also<br />
has broader appeal. Subjective measures of quality of life, however, do not<br />
have objective counterparts. For instance, there is no observed measure of<br />
happiness, whereas inflation can be measured as either actual or perceived<br />
inflation. They further note that subjective approaches allow for a distinction<br />
between quality of life dimensions and the objective factors that shape them.<br />
Subjective measures are not without problems. They are ordinal in nature<br />
and usually are not comparable across countries and cultures or reliable<br />
across time. Thus it can be misleading to use subjective indicators such as<br />
happiness as the only or main policy criterion. However, these indicators—<br />
appropriately measured and carefully used—can be valuable supplements<br />
to objective data to inform policy, particularly at the national level.<br />
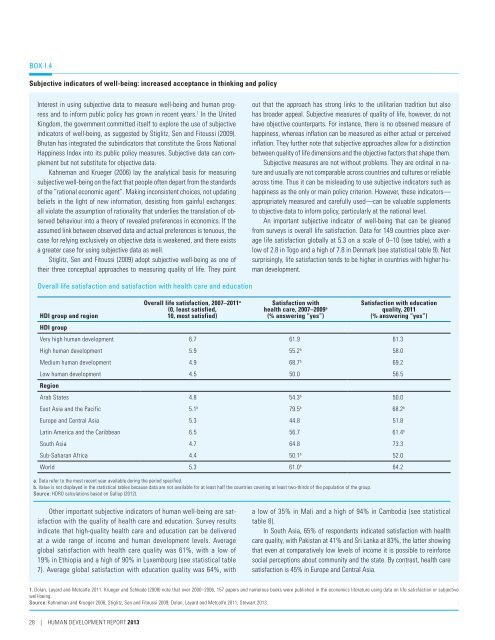
An important subjective indicator of well-being that can be gleaned<br />
from surveys is overall life satisfaction. Data for 149 countries place average<br />
life satisfaction globally at 5.3 on a scale of 0–10 (see table), with a<br />
low of 2.8 in Togo and a high of 7.8 in Denmark (see statistical table 9). Not<br />
surprisingly, life satisfaction tends to be higher in countries with higher human<br />
development.<br />
Overall life satisfaction and satisfaction with health care and education<br />
HDI group and region<br />
HDI group<br />
Overall life satisfaction, 2007–2011 a<br />
(0, least satisfied,<br />
10, most satisfied)<br />
Satisfaction with<br />
health care, 2007–2009 a<br />
(% answering “yes”)<br />
Satisfaction with education<br />
quality, 2011<br />
(% answering “yes”)<br />
Very high human development 6.7 61.9 61.3<br />
High human development 5.9 55.2 b 58.0<br />
Medium human development 4.9 68.7 b 69.2<br />
Low human development 4.5 50.0 56.5<br />
Region<br />
Arab States 4.8 54.3 b 50.0<br />
East Asia and the Pacific 5.1 b 79.5 b 68.2 b<br />
Europe and Central Asia 5.3 44.8 51.8<br />
Latin America and the Caribbean 6.5 56.7 61.4 b<br />
South Asia 4.7 64.8 73.3<br />
Sub-Saharan Africa 4.4 50.1 b 52.0<br />
World 5.3 61.0 b 64.2<br />
a. Data refer to the most recent year available during the period specified.<br />
b. Value is not displayed in the statistical tables because data are not available for at least half the countries covering at least two-thirds of the population of the group.<br />
Source: HDRO calculations based on Gallup (2012).<br />
Other important subjective indicators of human well-being are satisfaction<br />
with the quality of health care and education. Survey results<br />
indicate that high-quality health care and education can be delivered<br />
at a wide range of income and human development levels. Average<br />
global satisfaction with health care quality was 61%, with a low of<br />
19% in Ethiopia and a high of 90% in Luxembourg (see statistical table<br />
7). Average global satisfaction with education quality was 64%, with<br />
a low of 35% in Mali and a high of 94% in Cambodia (see statistical<br />
table 8).<br />
In South Asia, 65% of respondents indicated satisfaction with health<br />
care quality, with Pakistan at 41% and Sri Lanka at 83%, the latter showing<br />
that even at comparatively low levels of income it is possible to reinforce<br />
social perceptions about community and the state. By contrast, health care<br />
satisfaction is 45% in Europe and Central Asia.<br />
1. Dolan, Layard and Metcalfe 2011. Krueger and Schkade (2008) note that over 2000–2006, 157 papers and numerous books were published in the economics literature using data on life satisfaction or subjective<br />
well-being.<br />
Source: Kahneman and Krueger 2006; Stiglitz, Sen and Fitoussi 2009; Dolan, Layard and Metcalfe 2011; Stewart 2013.<br />
28 | HUMAN DevELOPMENT REPORT 2013