E N S W - United Nations Development Programme
E N S W - United Nations Development Programme
E N S W - United Nations Development Programme

You also want an ePaper? Increase the reach of your titles
YUMPU automatically turns print PDFs into web optimized ePapers that Google loves.
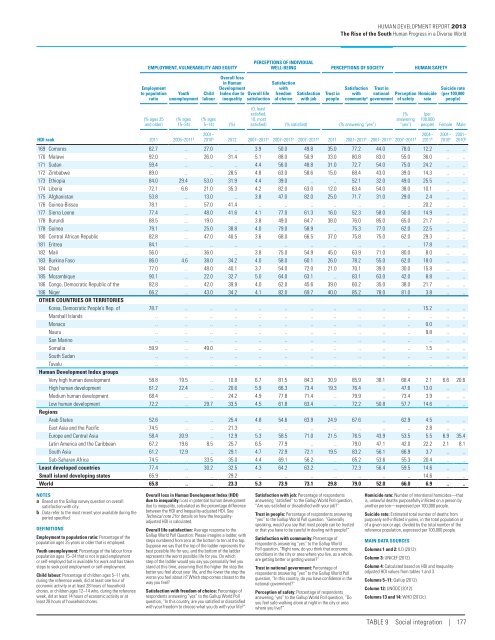
Human <strong>Development</strong> Report 2013<br />
The Rise of the South Human Progress in a Diverse World<br />
EMPLOYMENT, VULNERABILITY AND EQUITY<br />
Employment<br />
to population<br />
ratio<br />
(% ages 25<br />
and older)<br />
Youth<br />
unemployment<br />
(% ages<br />
15–24)<br />
Child<br />
labour<br />
Overall loss<br />
in Human<br />
<strong>Development</strong><br />
Index due to<br />
inequality<br />
(% ages<br />
5–14) (%)<br />
PERCEPTIONS OF INDIVIDUAL<br />
WELL-BEING PERCEPTIONS OF SOCIETY HUMAN SAFETY<br />
Overall life<br />
satisfaction<br />
Satisfaction<br />
with<br />
freedom Satisfaction<br />
of choice with job<br />
Trust in<br />
people<br />
Satisfaction<br />
with<br />
community a<br />
(0, least<br />
satisfied,<br />
10, most<br />
satisfied) (% satisfied) (% answering “yes”)<br />
Trust in<br />
national<br />
government<br />
Perception Homicide<br />
of safety rate<br />
(%<br />
answering<br />
“yes”)<br />
Suicide rate<br />
(per 100,000<br />
people)<br />
(per<br />
100,000<br />
people) Female Male<br />
HDI rank 2011 2005–2011 b 2010 b 2012 2007–2011 b 2007–2011 b 2007–2011 b 2011 2007–2011 b 2007–2011 b 2007–2011 b 2011 b 2010 b 2010 b<br />
2001–<br />
2004– 2001– 2001–<br />
169 Comoros 62.7 .. 27.0 .. 3.9 50.0 49.8 35.0 77.2 44.0 78.0 12.2 .. ..<br />
170 Malawi 92.0 .. 26.0 31.4 5.1 88.0 50.9 33.0 80.8 83.0 55.0 36.0 .. ..<br />
171 Sudan 59.4 89.0 .. .. .. 4.4 56.0 48.8 31.0 72.7 54.0 75.0 24.2 .. ..<br />
172 Zimbabwe 89.0 .. .. 28.5 4.8 63.0 58.6 15.0 68.4 43.0 39.0 14.3 .. ..<br />
173 Ethiopia 84.0 29.4 53.0 31.9 4.4 39.0 .. .. 52.1 32.0 49.0 25.5 .. ..<br />
174 Liberia 72.1 6.6 21.0 35.3 4.2 82.0 63.0 12.0 63.4 54.0 38.0 10.1 .. ..<br />
175 Afghanistan 53.8 .. 13.0 .. 3.8 47.0 82.0 25.0 71.7 31.0 29.0 2.4 .. ..<br />
176 Guinea-Bissau 78.1 .. 57.0 41.4 .. .. .. .. .. .. .. 20.2 .. ..<br />
177 Sierra Leone 77.4 .. 48.0 41.6 4.1 77.0 61.3 16.0 52.3 58.0 50.0 14.9 .. ..<br />
178 Burundi 88.5 .. 19.0 .. 3.8 49.0 64.7 38.0 76.0 85.0 65.0 21.7 .. ..<br />
178 Guinea 79.1 .. 25.0 38.8 4.0 79.0 58.9 .. 75.3 77.0 62.0 22.5 .. ..<br />
180 Central African Republic 82.8 .. 47.0 40.5 3.6 68.0 66.5 37.0 75.8 75.0 62.0 29.3 .. ..<br />
181 Eritrea 84.1 .. .. .. .. .. .. .. .. .. .. 17.8 .. ..<br />
182 Mali 56.0 .. 36.0 .. 3.8 75.0 54.9 45.0 63.9 71.0 80.0 8.0 .. ..<br />
183 Burkina Faso 86.0 4.6 38.0 34.2 4.0 58.0 60.1 26.0 78.2 55.0 62.0 18.0 .. ..<br />
184 Chad 77.0 .. 48.0 40.1 3.7 54.0 72.0 21.0 70.1 39.0 30.0 15.8 .. ..<br />
185 Mozambique 90.1 .. 22.0 32.7 5.0 64.0 63.1 .. 83.1 63.0 42.0 8.8 .. ..<br />
186 Congo, Democratic Republic of the 82.8 .. 42.0 39.9 4.0 62.0 45.6 39.0 60.2 35.0 38.0 21.7 .. ..<br />
186 Niger 66.2 .. 43.0 34.2 4.1 82.0 69.7 40.0 85.2 78.0 81.0 3.8 .. ..<br />
Other countries or territories<br />
Korea, Democratic People’s Rep. of 78.7 .. .. .. .. .. .. .. .. .. .. 15.2 .. ..<br />
Marshall Islands .. .. .. .. .. .. .. .. .. .. .. .. .. ..<br />
Monaco .. .. .. .. .. .. .. .. .. .. .. 0.0 .. ..<br />
Nauru .. .. .. .. .. .. .. .. .. .. .. 9.8 .. ..<br />
San Marino .. .. .. .. .. .. .. .. .. .. .. .. .. ..<br />
Somalia 59.9 .. 49.0 .. .. .. .. .. .. .. .. 1.5 .. ..<br />
South Sudan .. .. .. .. .. .. .. .. .. .. .. .. .. ..<br />
Tuvalu .. .. .. .. .. .. .. .. .. .. .. .. .. ..<br />
Human <strong>Development</strong> Index groups<br />
Very high human development 58.8 19.5 .. 10.8 6.7 81.5 84.3 30.9 85.9 38.1 68.4 2.1 6.6 20.6<br />
High human development 61.2 22.4 .. 20.6 5.9 66.3 73.4 19.3 76.4 .. 47.6 13.0 .. ..<br />
Medium human development 68.4 .. .. 24.2 4.9 77.8 71.4 .. 79.9 .. 73.4 3.9 .. ..<br />
Low human development 72.2 .. 29.7 33.5 4.5 61.8 63.4 .. 72.2 50.8 57.7 14.6 .. ..<br />
Regions<br />
Arab States 52.6 .. .. 25.4 4.8 54.6 63.9 24.9 67.6 .. 62.9 4.5 .. ..<br />
East Asia and the Pacific 74.5 .. .. 21.3 .. .. .. .. .. .. .. 2.8 .. ..<br />
Europe and Central Asia 58.4 20.9 .. 12.9 5.3 58.5 71.0 21.5 76.5 43.9 53.5 5.5 6.9 35.4<br />
Latin America and the Caribbean 67.2 19.6 8.5 25.7 6.5 77.9 .. .. 79.0 47.1 42.0 22.2 2.1 8.1<br />
South Asia 61.2 12.9 .. 29.1 4.7 72.9 72.1 19.5 83.2 56.1 66.9 3.7 .. ..<br />
Sub-Saharan Africa 74.5 .. 33.5 35.0 4.4 69.1 56.2 .. 65.2 53.6 55.3 20.4 .. ..<br />
Least developed countries 77.4 .. 30.2 32.5 4.3 64.2 63.2 .. 72.3 56.4 59.5 14.6 .. ..<br />
Small island developing states 65.9 .. .. 29.2 .. .. .. .. .. .. .. 14.6 .. ..<br />
World 65.8 .. .. 23.3 5.3 73.9 73.1 29.8 79.0 52.0 66.0 6.9 .. ..<br />
NOTES<br />
a Based on the Gallup survey question on overall<br />
satisfaction with city.<br />
b Data refer to the most recent year available during the<br />
period specified.<br />
DEFINITIONS<br />
Employment to population ratio: Percentage of the<br />
population ages 25 years or older that is employed.<br />
Youth unemployment: Percentage of the labour force<br />
population ages 15–24 that is not in paid employment<br />
or self-employed but is available for work and has taken<br />
steps to seek paid employment or self-employment.<br />
Child labour: Percentage of children ages 5–11 who,<br />
during the reference week, did at least one hour of<br />
economic activity or at least 28 hours of household<br />
chores, or children ages 12–14 who, during the reference<br />
week, did at least 14 hours of economic activity or at<br />
least 28 hours of household chores.<br />
Overall loss in Human <strong>Development</strong> Index (HDI)<br />
due to inequality: Loss in potential human development<br />
due to inequality, calculated as the percentage difference<br />
between the HDI and Inequality-adjusted HDI. See<br />
Technical note 2 for details on how the Inequalityadjusted<br />
HDI is calculated.<br />
Overall life satisfaction: Average response to the<br />
Gallup World Poll Question: Please imagine a ladder, with<br />
steps numbered from zero at the bottom to ten at the top.<br />
Suppose we say that the top of the ladder represents the<br />
best possible life for you, and the bottom of the ladder<br />
represents the worst possible life for you. On which<br />
step of the ladder would you say you personally feel you<br />
stand at this time, assuming that the higher the step the<br />
better you feel about your life, and the lower the step the<br />
worse you feel about it Which step comes closest to the<br />
way you feel<br />
Satisfaction with freedom of choice: Percentage of<br />
respondents answering “yes” to the Gallup World Poll<br />
question, “In this country, are you satisfied or dissatisfied<br />
with your freedom to choose what you do with your life”<br />
Satisfaction with job: Percentage of respondents<br />
answering “satisfied” to the Gallup World Poll question,<br />
“Are you satisfied or dissatisfied with your job”<br />
Trust in people: Percentage of respondents answering<br />
“yes” to the Gallup World Poll question, “Generally<br />
speaking, would you say that most people can be trusted<br />
or that you have to be careful in dealing with people”<br />
Satisfaction with community: Percentage of<br />
respondents answering “yes” to the Gallup World<br />
Poll question, “Right now, do you think that economic<br />
conditions in the city or area where you live, as a whole,<br />
are getting better or getting worse”<br />
Trust in national government: Percentage of<br />
respondents answering “yes” to the Gallup World Poll<br />
question, “In this country, do you have confidence in the<br />
national government”<br />
Perception of safety: Percentage of respondents<br />
answering “yes” to the Gallup World Poll question, “Do<br />
you feel safe walking alone at night in the city or area<br />
where you live”<br />
Homicide rate: Number of intentional homicides—that<br />
is, unlawful deaths purposefully inflicted on a person by<br />
another person—expressed per 100,000 people.<br />
Suicide rate: Estimated total number of deaths from<br />
purposely self-inflicted injuries, in the total population or<br />
of a given sex or age, divided by the total number of the<br />
reference population, expressed per 100,000 people.<br />
MAIN DATA SOURCES<br />
Columns 1 and 2: ILO (2012).<br />
Column 3: UNICEF (2012).<br />
Column 4: Calculated based on HDI and Inequalityadjusted<br />
HDI values from tables 1 and 3.<br />
Columns 5–11: Gallup (2012).<br />
Column 12: UNODC (2012).<br />
Columns 13 and 14: WHO (2012c).<br />
Table 9 Social integration | 177