E N S W - United Nations Development Programme
E N S W - United Nations Development Programme
E N S W - United Nations Development Programme

You also want an ePaper? Increase the reach of your titles
YUMPU automatically turns print PDFs into web optimized ePapers that Google loves.
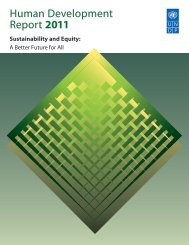
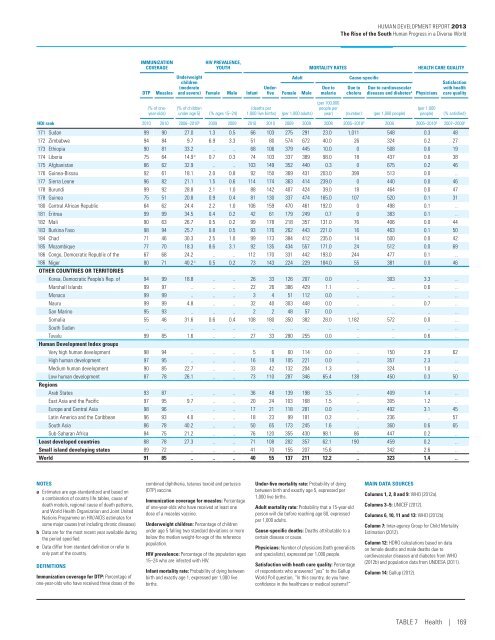
Human <strong>Development</strong> Report 2013<br />
The Rise of the South Human Progress in a Diverse World<br />
IMMUNIZATION<br />
COVERAGE<br />
DTP Measles<br />
Underweight<br />
children<br />
(moderate<br />
and severe) Female Male Infant<br />
(% of oneyear-olds)<br />
HIV PREVALENCE,<br />
YOUTH MORTALITY RATES HEALTH CARE QUALITY<br />
(% of children<br />
under age 5) (% ages 15–24)<br />
Underfive<br />
Female<br />
Adult<br />
Male<br />
(deaths per<br />
1,000 live births) (per 1,000 adults)<br />
Due to<br />
malaria<br />
Cause-specific<br />
Due to<br />
cholera<br />
Due to cardiovascular<br />
diseases and diabetes a<br />
(per 100,000<br />
people per<br />
year) (number) (per 1,000 people)<br />
Physicians<br />
(per 1,000<br />
people)<br />
Satisfaction<br />
with health<br />
care quality<br />
(% satisfied)<br />
HDI rank 2010 2010 2006–2010 b 2009 2009 2010 2010 2009 2009 2008 2005–2010 b 2008 2005–2010 b 2007–2009 b<br />
171 Sudan 99 90 27.0 1.3 0.5 66 103 275 291 23.0 1,011 548 0.3 48<br />
172 Zimbabwe 94 84 9.7 6.9 3.3 51 80 574 672 40.0 26 324 0.2 27<br />
173 Ethiopia 90 81 33.2 .. .. 68 106 379 445 10.0 0 508 0.0 19<br />
174 Liberia 75 64 14.9 c 0.7 0.3 74 103 337 389 98.0 18 437 0.0 38<br />
175 Afghanistan 86 62 32.9 .. .. 103 149 352 440 0.3 0 675 0.2 46<br />
176 Guinea-Bissau 92 61 18.1 2.0 0.8 92 150 369 431 203.0 399 513 0.0 ..<br />
177 Sierra Leone 96 82 21.1 1.5 0.6 114 174 363 414 239.0 0 440 0.0 46<br />
178 Burundi 99 92 28.8 2.1 1.0 88 142 407 424 39.0 18 464 0.0 47<br />
178 Guinea 75 51 20.8 0.9 0.4 81 130 337 474 165.0 107 520 0.1 31<br />
180 Central African Republic 64 62 24.4 2.2 1.0 106 159 470 461 192.0 0 498 0.1 ..<br />
181 Eritrea 99 99 34.5 0.4 0.2 42 61 179 249 0.7 0 383 0.1 ..<br />
182 Mali 90 63 26.7 0.5 0.2 99 178 218 357 131.0 76 406 0.0 44<br />
183 Burkina Faso 98 94 25.7 0.8 0.5 93 176 262 443 221.0 16 463 0.1 50<br />
184 Chad 71 46 30.3 2.5 1.0 99 173 384 412 235.0 14 500 0.0 42<br />
185 Mozambique 77 70 18.3 8.6 3.1 92 135 434 557 171.0 24 512 0.0 69<br />
186 Congo, Democratic Republic of the 67 68 24.2 .. .. 112 170 331 442 193.0 244 477 0.1 ..<br />
186 Niger 80 71 40.2 c 0.5 0.2 73 143 224 229 184.0 55 381 0.0 46<br />
Other countries or territories<br />
Korea, Democratic People’s Rep. of 94 99 18.8 .. .. 26 33 126 207 0.0 .. 303 3.3 ..<br />
Marshall Islands 99 97 .. .. .. 22 26 386 429 1.1 .. .. 0.6 ..<br />
Monaco 99 99 .. .. .. 3 4 51 112 0.0 .. .. .. ..<br />
Nauru 99 99 4.8 .. .. 32 40 303 448 0.0 .. .. 0.7 ..<br />
San Marino 95 93 .. .. .. 2 2 48 57 0.0 .. .. .. ..<br />
Somalia 55 46 31.6 0.6 0.4 108 180 350 382 28.0 1,182 572 0.0 ..<br />
South Sudan .. .. .. .. .. .. .. .. .. .. .. .. .. ..<br />
Tuvalu 99 85 1.6 .. .. 27 33 280 255 0.0 .. .. 0.6 ..<br />
Human <strong>Development</strong> Index groups<br />
Very high human development 98 94 .. .. .. 5 6 60 114 0.0 .. 150 2.9 62<br />
High human development 97 95 .. .. .. 16 18 105 221 0.0 .. 357 2.3 ..<br />
Medium human development 90 85 22.7 .. .. 33 42 132 204 1.3 .. 324 1.0 ..<br />
Low human development 87 78 26.1 .. .. 73 110 287 346 65.4 138 450 0.3 50<br />
Regions<br />
Arab States 93 87 .. .. .. 36 48 139 198 3.5 .. 409 1.4 ..<br />
East Asia and the Pacific 97 95 9.7 .. .. 20 24 103 168 1.5 .. 305 1.2 ..<br />
Europe and Central Asia 98 96 .. .. .. 17 21 118 281 0.0 .. 492 3.1 45<br />
Latin America and the Caribbean 96 93 4.0 .. .. 18 23 99 181 0.2 .. 236 .. 57<br />
South Asia 86 78 40.2 .. .. 50 65 173 245 1.6 .. 360 0.6 65<br />
Sub-Saharan Africa 84 75 21.2 .. .. 76 120 355 430 98.1 86 447 0.2 ..<br />
Least developed countries 88 78 27.3 .. .. 71 108 282 357 62.1 190 459 0.2 ..<br />
Small island developing states 89 72 .. .. .. 41 70 155 207 15.6 .. 342 2.6 ..<br />
World 91 85 .. .. .. 40 55 137 211 12.2 .. 323 1.4 ..<br />
NOTES<br />
a Estimates are age-standardized and based on<br />
a combination of country life tables, cause of<br />
death models, regional cause of death patterns,<br />
and World Health Organization and Joint <strong>United</strong><br />
<strong>Nations</strong> <strong>Programme</strong> on HIV/AIDS estimates for<br />
some major causes (not including chronic diseases).<br />
b Data are for the most recent year available during<br />
the period specified.<br />
c Data differ from standard definition or refer to<br />
only part of the country.<br />
DEFINITIONS<br />
Immunization coverage for DTP: Percentage of<br />
one-year-olds who have received three doses of the<br />
combined diphtheria, tetanus toxoid and pertussis<br />
(DTP) vaccine.<br />
Immunization coverage for measles: Percentage<br />
of one-year-olds who have received at least one<br />
dose of a measles vaccine.<br />
Underweight children: Percentage of children<br />
under age 5 falling two standard deviations or more<br />
below the median weight-for-age of the reference<br />
population.<br />
HIV prevalence: Percentage of the population ages<br />
15–24 who are infected with HIV.<br />
Infant mortality rate: Probability of dying between<br />
birth and exactly age 1, expressed per 1,000 live<br />
births.<br />
Under-five mortality rate: Probability of dying<br />
between birth and exactly age 5, expressed per<br />
1,000 live births.<br />
Adult mortality rate: Probability that a 15-year-old<br />
person will die before reaching age 60, expressed<br />
per 1,000 adults.<br />
Cause-specific deaths: Deaths attributable to a<br />
certain disease or cause.<br />
Physicians: Number of physicians (both generalists<br />
and specialists), expressed per 1,000 people.<br />
Satisfaction with heath care quality: Percentage<br />
of respondents who answered “yes” to the Gallup<br />
World Poll question, “In this country, do you have<br />
confidence in the healthcare or medical systems”<br />
MAIN DATA SOURCES<br />
Columns 1, 2, 8 and 9: WHO (2012a).<br />
Columns 3–5: UNICEF (2012).<br />
Columns 6, 10, 11 and 13: WHO (2012b).<br />
Column 7: Inter-agency Group for Child Mortality<br />
Estimation (2012).<br />
Column 12: HDRO calculations based on data<br />
on female deaths and male deaths due to<br />
cardiovascular diseases and diabetes from WHO<br />
(2012b) and population data from UNDESA (2011).<br />
Column 14: Gallup (2012).<br />
Table 7 Health | 169