2006 Parks, Trails and Open Space Plan - City of Lakeville
2006 Parks, Trails and Open Space Plan - City of Lakeville
2006 Parks, Trails and Open Space Plan - City of Lakeville

Create successful ePaper yourself
Turn your PDF publications into a flip-book with our unique Google optimized e-Paper software.
Socioeconomic Pr<strong>of</strong>ile<br />
Population<br />
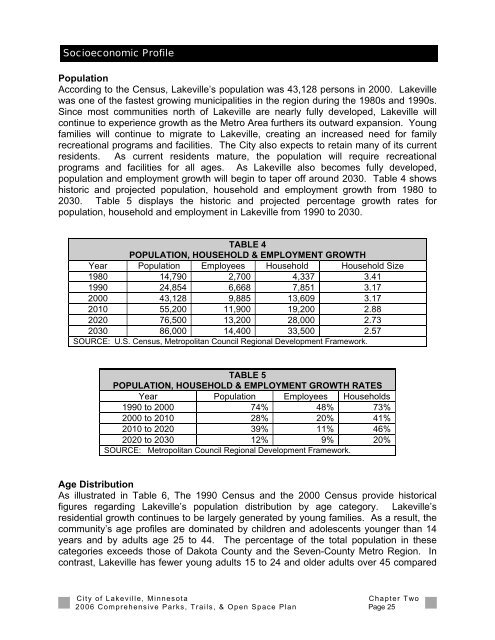
According to the Census, <strong>Lakeville</strong>’s population was 43,128 persons in 2000. <strong>Lakeville</strong><br />
was one <strong>of</strong> the fastest growing municipalities in the region during the 1980s <strong>and</strong> 1990s.<br />
Since most communities north <strong>of</strong> <strong>Lakeville</strong> are nearly fully developed, <strong>Lakeville</strong> will<br />
continue to experience growth as the Metro Area furthers its outward expansion. Young<br />
families will continue to migrate to <strong>Lakeville</strong>, creating an increased need for family<br />
recreational programs <strong>and</strong> facilities. The <strong>City</strong> also expects to retain many <strong>of</strong> its current<br />
residents. As current residents mature, the population will require recreational<br />
programs <strong>and</strong> facilities for all ages. As <strong>Lakeville</strong> also becomes fully developed,<br />
population <strong>and</strong> employment growth will begin to taper <strong>of</strong>f around 2030. Table 4 shows<br />
historic <strong>and</strong> projected population, household <strong>and</strong> employment growth from 1980 to<br />
2030. Table 5 displays the historic <strong>and</strong> projected percentage growth rates for<br />
population, household <strong>and</strong> employment in <strong>Lakeville</strong> from 1990 to 2030.<br />
TABLE 4<br />
POPULATION, HOUSEHOLD & EMPLOYMENT GROWTH<br />
Year Population Employees Household Household Size<br />
1980 14,790 2,700 4,337 3.41<br />
1990 24,854 6,668 7,851 3.17<br />
2000 43,128 9,885 13,609 3.17<br />
2010 55,200 11,900 19,200 2.88<br />
2020 76,500 13,200 28,000 2.73<br />
2030 86,000 14,400 33,500 2.57<br />
SOURCE: U.S. Census, Metropolitan Council Regional Development Framework.<br />
TABLE 5<br />
POPULATION, HOUSEHOLD & EMPLOYMENT GROWTH RATES<br />
Year Population Employees Households<br />
1990 to 2000 74% 48% 73%<br />
2000 to 2010 28% 20% 41%<br />
2010 to 2020 39% 11% 46%<br />
2020 to 2030 12% 9% 20%<br />
SOURCE: Metropolitan Council Regional Development Framework.<br />
Age Distribution<br />
As illustrated in Table 6, The 1990 Census <strong>and</strong> the 2000 Census provide historical<br />
figures regarding <strong>Lakeville</strong>’s population distribution by age category. <strong>Lakeville</strong>’s<br />
residential growth continues to be largely generated by young families. As a result, the<br />
community’s age pr<strong>of</strong>iles are dominated by children <strong>and</strong> adolescents younger than 14<br />
years <strong>and</strong> by adults age 25 to 44. The percentage <strong>of</strong> the total population in these<br />
categories exceeds those <strong>of</strong> Dakota County <strong>and</strong> the Seven-County Metro Region. In<br />
contrast, <strong>Lakeville</strong> has fewer young adults 15 to 24 <strong>and</strong> older adults over 45 compared<br />
<strong>City</strong> <strong>of</strong> <strong>Lakeville</strong>, Minnesota<br />
Chapter Two<br />
<strong>2006</strong> Comprehensive <strong>Parks</strong>, <strong>Trails</strong>, & <strong>Open</strong> <strong>Space</strong> <strong>Plan</strong> Page 25