2006 Parks, Trails and Open Space Plan - City of Lakeville
2006 Parks, Trails and Open Space Plan - City of Lakeville
2006 Parks, Trails and Open Space Plan - City of Lakeville

Create successful ePaper yourself
Turn your PDF publications into a flip-book with our unique Google optimized e-Paper software.
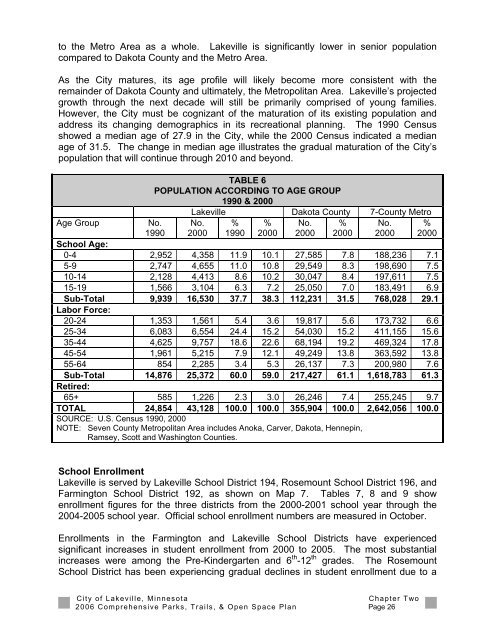
to the Metro Area as a whole. <strong>Lakeville</strong> is significantly lower in senior population<br />
compared to Dakota County <strong>and</strong> the Metro Area.<br />
As the <strong>City</strong> matures, its age pr<strong>of</strong>ile will likely become more consistent with the<br />
remainder <strong>of</strong> Dakota County <strong>and</strong> ultimately, the Metropolitan Area. <strong>Lakeville</strong>’s projected<br />
growth through the next decade will still be primarily comprised <strong>of</strong> young families.<br />
However, the <strong>City</strong> must be cognizant <strong>of</strong> the maturation <strong>of</strong> its existing population <strong>and</strong><br />
address its changing demographics in its recreational planning. The 1990 Census<br />
showed a median age <strong>of</strong> 27.9 in the <strong>City</strong>, while the 2000 Census indicated a median<br />
age <strong>of</strong> 31.5. The change in median age illustrates the gradual maturation <strong>of</strong> the <strong>City</strong>’s<br />
population that will continue through 2010 <strong>and</strong> beyond.<br />
Age Group<br />
TABLE 6<br />
POPULATION ACCORDING TO AGE GROUP<br />
1990 & 2000<br />
No.<br />
1990<br />
<strong>Lakeville</strong> Dakota County 7-County Metro<br />
% % No. % No.<br />
1990 2000 2000 2000 2000<br />
No.<br />
2000<br />
%<br />
2000<br />
School Age:<br />
0-4 2,952 4,358 11.9 10.1 27,585 7.8 188,236 7.1<br />
5-9 2,747 4,655 11.0 10.8 29,549 8.3 198,690 7.5<br />
10-14 2,128 4,413 8.6 10.2 30,047 8.4 197,611 7.5<br />
15-19 1,566 3,104 6.3 7.2 25,050 7.0 183,491 6.9<br />
Sub-Total 9,939 16,530 37.7 38.3 112,231 31.5 768,028 29.1<br />
Labor Force:<br />
20-24 1,353 1,561 5.4 3.6 19,817 5.6 173,732 6.6<br />
25-34 6,083 6,554 24.4 15.2 54,030 15.2 411,155 15.6<br />
35-44 4,625 9,757 18.6 22.6 68,194 19.2 469,324 17.8<br />
45-54 1,961 5,215 7.9 12.1 49,249 13.8 363,592 13.8<br />
55-64 854 2,285 3.4 5.3 26,137 7.3 200,980 7.6<br />
Sub-Total 14,876 25,372 60.0 59.0 217,427 61.1 1,618,783 61.3<br />
Retired:<br />
65+ 585 1,226 2.3 3.0 26,246 7.4 255,245 9.7<br />
TOTAL 24,854 43,128 100.0 100.0 355,904 100.0 2,642,056 100.0<br />
SOURCE: U.S. Census 1990, 2000<br />
NOTE: Seven County Metropolitan Area includes Anoka, Carver, Dakota, Hennepin,<br />
Ramsey, Scott <strong>and</strong> Washington Counties.<br />
School Enrollment<br />
<strong>Lakeville</strong> is served by <strong>Lakeville</strong> School District 194, Rosemount School District 196, <strong>and</strong><br />
Farmington School District 192, as shown on Map 7. Tables 7, 8 <strong>and</strong> 9 show<br />
enrollment figures for the three districts from the 2000-2001 school year through the<br />
2004-2005 school year. Official school enrollment numbers are measured in October.<br />
Enrollments in the Farmington <strong>and</strong> <strong>Lakeville</strong> School Districts have experienced<br />
significant increases in student enrollment from 2000 to 2005. The most substantial<br />
increases were among the Pre-Kindergarten <strong>and</strong> 6 th -12 th grades. The Rosemount<br />
School District has been experiencing gradual declines in student enrollment due to a<br />
<strong>City</strong> <strong>of</strong> <strong>Lakeville</strong>, Minnesota<br />
Chapter Two<br />
<strong>2006</strong> Comprehensive <strong>Parks</strong>, <strong>Trails</strong>, & <strong>Open</strong> <strong>Space</strong> <strong>Plan</strong> Page 26