50 - Sample FBR Franchisee Satisfaction Reports

Create successful ePaper yourself
Turn your PDF publications into a flip-book with our unique Google optimized e-Paper software.
(fsi)<br />
The Benchmark of <strong>Franchisee</strong> <strong>Satisfaction</strong><br />
The <strong>Franchisee</strong> <strong>Satisfaction</strong> Index (FSI) is the industry standard by which the<br />
health of a franchise company can be measured and tracked over time.<br />
Established by Franchise Business Review in 2007, FSI is a collective assessment<br />
of the critical areas of franchisee satisfaction.<br />
Franchise Business Review has surveyed nearly 600 of today’s leading franchise<br />
brands, representing tens of thousands of franchise owners. This data makes our<br />
Franchise <strong>Satisfaction</strong> Index a powerful tool for evaluating franchises, tracking<br />
operational performance and predicting future success.<br />
The seven areas of franchisee satisfaction included in the FSI are:<br />
Training & Support<br />
Business success is all about execution. The critical areas of franchisee training<br />
and support provide the foundation that makes long-term success possible.<br />
Franchise System<br />
Proven systems and established procedures are why most people invest in a<br />
franchise. These are the things that make a franchise run smoothly, maintain a<br />
competitive advantage and achieve greater success over time.<br />
Leadership, Core Values and <strong>Franchisee</strong> Community<br />
Building a successful business and making money are important to every franchise<br />
owner, but much of the long-term satisfaction and day-to-day enjoyment of a<br />
business comes from the strength of the relationship between franchisors and<br />
franchisees. Strong relationships can overcome many business challenges.<br />
Financial Opportunity<br />
While the financial goals of franchisees vary widely, making a living and earning a<br />
reasonable return on their investment is something that most share in common.<br />
General <strong>Satisfaction</strong><br />
General satisfaction is where the rubber meets the road. Has the experience of<br />
owning a franchise lived up to the expectations of the franchisee? Would they<br />
recommend you to others? And most importantly, would they do it again?<br />
Understanding FSI<br />
FSI can range from 0 to 100% and represents a<br />
weighted average of positive responses to a specific<br />
question or a group of questions within one of the<br />
areas being measured for satisfaction. If you were to<br />
simply add up all the positive responses to a<br />
question, giving the same value to an “excellent”<br />
response that you give to a “good” or “very good”<br />
response, you would paint an overly optimistic<br />
picture. FSI provides a realistic view of favorable<br />
satisfaction ratings by weighting more positive<br />
responses and discounting lesser responses to any<br />
given question. FSI ratings provide a reference point<br />
or benchmark to help gauge the overall level of<br />
franchisee satisfaction or satisfaction in a specific<br />
area.<br />
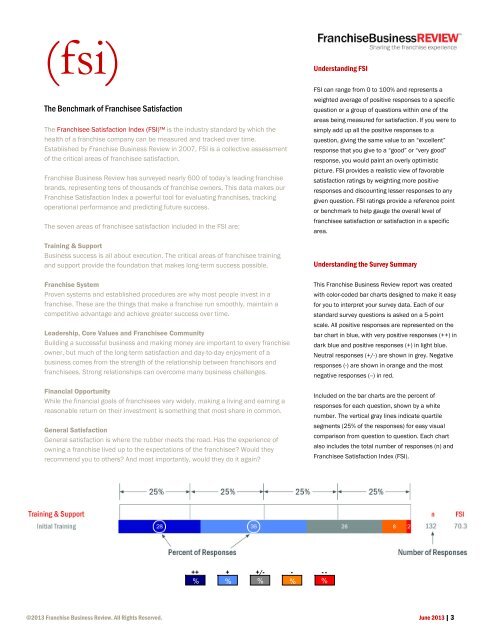
Understanding the Survey Summary<br />
This Franchise Business Review report was created<br />
with color-coded bar charts designed to make it easy<br />
for you to interpret your survey data. Each of our<br />
standard survey questions is asked on a 5-point<br />
scale. All positive responses are represented on the<br />
bar chart in blue, with very positive responses (++) in<br />
dark blue and positive responses (+) in light blue.<br />
Neutral responses (+/-) are shown in grey. Negative<br />
responses (-) are shown in orange and the most<br />
negative responses (--) in red.<br />
Included on the bar charts are the percent of<br />
responses for each question, shown by a white<br />
number. The vertical gray lines indicate quartile<br />
segments (25% of the responses) for easy visual<br />
comparison from question to question. Each chart<br />
also includes the total number of responses (n) and<br />
<strong>Franchisee</strong> <strong>Satisfaction</strong> Index (FSI).<br />
++ + +/- - - -<br />
% % % % %<br />
©2013 Franchise Business Review. All Rights Reserved. June 2013 | 3