PlascoTrac User Guide
PlascoTrac User Guide
PlascoTrac User Guide

Create successful ePaper yourself
Turn your PDF publications into a flip-book with our unique Google optimized e-Paper software.
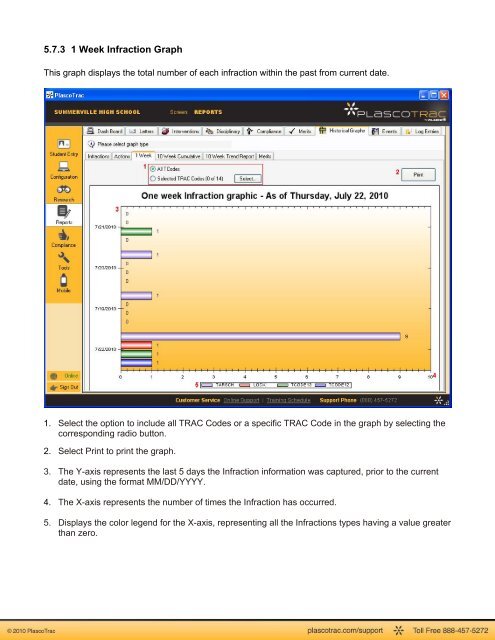
5.7.3 1 Week Infraction GraphThis graph displays the total number of each infraction within the past from current date.1. Select the option to include all TRAC Codes or a specific TRAC Code in the graph by selecting thecorresponding radio button.2. Select Print to print the graph.3. The Y-axis represents the last 5 days the Infraction information was captured, prior to the currentdate, using the format MM/DD/YYYY.4. The X-axis represents the number of times the Infraction has occurred.5. Displays the color legend for the X-axis, representing all the Infractions types having a value greaterthan zero.