PlascoTrac User Guide
PlascoTrac User Guide
PlascoTrac User Guide
SHOW LESS

Create successful ePaper yourself
Turn your PDF publications into a flip-book with our unique Google optimized e-Paper software.
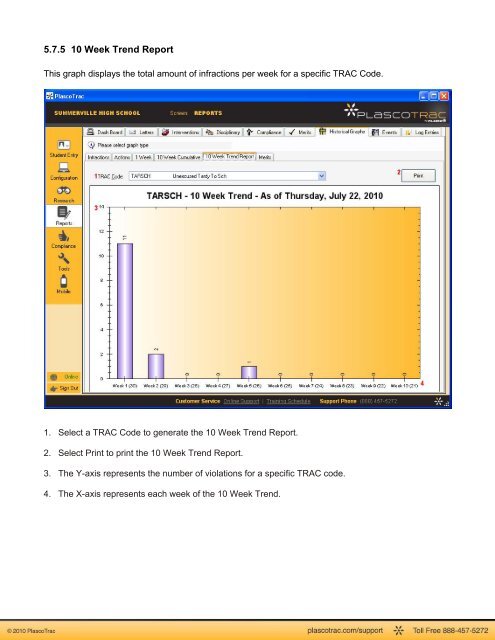
5.7.5 10 Week Trend ReportThis graph displays the total amount of infractions per week for a specific TRAC Code.1. Select a TRAC Code to generate the 10 Week Trend Report.2. Select Print to print the 10 Week Trend Report.3. The Y-axis represents the number of violations for a specific TRAC code.4. The X-axis represents each week of the 10 Week Trend.