Transportation 2035 - State of Rhode Island: Division of Planning
Transportation 2035 - State of Rhode Island: Division of Planning
Transportation 2035 - State of Rhode Island: Division of Planning

You also want an ePaper? Increase the reach of your titles
YUMPU automatically turns print PDFs into web optimized ePapers that Google loves.
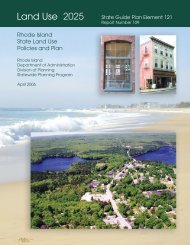
December 2012LAND USE SCENARIO ANALYSISLand Use 2025, <strong>Rhode</strong> <strong>Island</strong>’s statewide land use plan, established a boundary called the Urban Services Area. Inside the urban area, public water andwastewater infrastructure exists to support more dense population growth. Outside this area, this infrastructure does not exist, and it is considered to be inthe <strong>State</strong>’s best interest to maintain this area in more <strong>of</strong> a rural state for scenic, environmental, fiscal, and quality <strong>of</strong> life reasons. The urban area generallyincludes everything around Narragansett Bay and the Blackstone Valley, and small areas in Burrillville, Jamestown, and Westerly. Village scale Growth Centersare also permitted in certain rural areas.A scenario planning exercise was completed by <strong>Rhode</strong> <strong>Island</strong> <strong>State</strong>wide <strong>Planning</strong> Program that looks at varying degrees <strong>of</strong> density inside the urban area andthen begins to investigate the transportation impacts that may have. The Travel Demand Model was used to analyze population and employment growth byassigning different percentages <strong>of</strong> population and employment growth to Traffic Analysis Zones (TAZ’s) inside and outside the urban area. The total numbersremain the same – only the distribution changes.Population and Employment GrowthYear Population Employment2000 1,048,319 467,2992030 1,140,543 516,048Change 92,224 48,749The three scenarios are as follows for Current Trend, Sprawl Scenario, and Compact Scenario:CURRENT TRENDThis reflects the current population and employment projections as assigned to the TAZ’s for use in forecasting VMT and emissions. This is consideredto be the best available data. The current trend shows 55 percent <strong>of</strong> the growth going to TAZ’s inside the urban area and 45 percent outside (55 / 45split).SPRAWL SCENARIOIn this scenario, the rural area absorbs more <strong>of</strong> the population and employment growth (20 percentage points more <strong>of</strong> the 2000-2030 growth than inthe Current Trend for a 35 / 65 split).COMPACT SCENARIOIn this scenario, the urban area absorbs more <strong>of</strong> the population and employment growth (30 percentage points more <strong>of</strong> the 2000-2030 growth than inthe Current Trend for an 85 / 15 split).<strong>Transportation</strong> <strong>2035</strong> (2012 Update)<strong>State</strong> Guide Plan Element 611RI <strong>State</strong>wide <strong>Planning</strong> ProgramPage 4-9