C - Michigan Technological University
C - Michigan Technological University
C - Michigan Technological University
- No tags were found...
You also want an ePaper? Increase the reach of your titles
YUMPU automatically turns print PDFs into web optimized ePapers that Google loves.
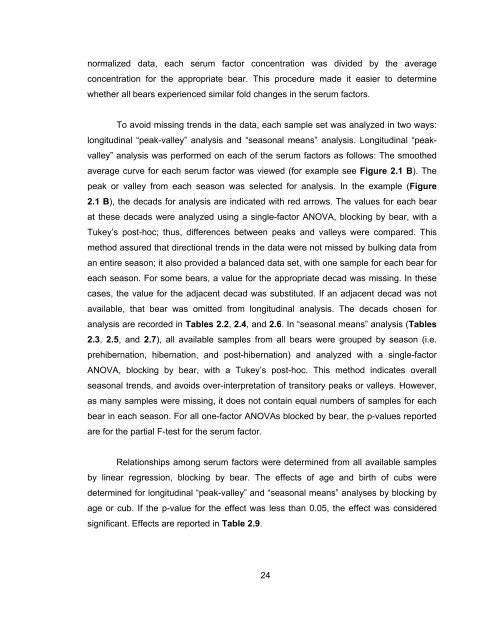
normalized data, each serum factor concentration was divided by the averageconcentration for the appropriate bear. This procedure made it easier to determinewhether all bears experienced similar fold changes in the serum factors.To avoid missing trends in the data, each sample set was analyzed in two ways:longitudinal “peak-valley” analysis and “seasonal means” analysis. Longitudinal “peakvalley”analysis was performed on each of the serum factors as follows: The smoothedaverage curve for each serum factor was viewed (for example see Figure 2.1 B). Thepeak or valley from each season was selected for analysis. In the example (Figure2.1 B), the decads for analysis are indicated with red arrows. The values for each bearat these decads were analyzed using a single-factor ANOVA, blocking by bear, with aTukey’s post-hoc; thus, differences between peaks and valleys were compared. Thismethod assured that directional trends in the data were not missed by bulking data froman entire season; it also provided a balanced data set, with one sample for each bear foreach season. For some bears, a value for the appropriate decad was missing. In thesecases, the value for the adjacent decad was substituted. If an adjacent decad was notavailable, that bear was omitted from longitudinal analysis. The decads chosen foranalysis are recorded in Tables 2.2, 2.4, and 2.6. In “seasonal means” analysis (Tables2.3, 2.5, and 2.7), all available samples from all bears were grouped by season (i.e.prehibernation, hibernation, and post-hibernation) and analyzed with a single-factorANOVA, blocking by bear, with a Tukey’s post-hoc. This method indicates overallseasonal trends, and avoids over-interpretation of transitory peaks or valleys. However,as many samples were missing, it does not contain equal numbers of samples for eachbear in each season. For all one-factor ANOVAs blocked by bear, the p-values reportedare for the partial F-test for the serum factor.Relationships among serum factors were determined from all available samplesby linear regression, blocking by bear. The effects of age and birth of cubs weredetermined for longitudinal “peak-valley” and “seasonal means” analyses by blocking byage or cub. If the p-value for the effect was less than 0.05, the effect was consideredsignificant. Effects are reported in Table 2.9.24


