- Page 1 and 2:
EXPLORATION OF THE ROLE OF SERUM FA
- Page 3 and 4:
Table of contentsIndex of Figures .
- Page 5 and 6:
Chapter Four - Attempts to find an
- Page 7 and 8: Index of figures1.1. Simplified sch
- Page 9 and 10: 6.17. Longitudinal analysis of OPG
- Page 11 and 12: 6.49. Longitudinal analysis of ColI
- Page 13 and 14: A.2. Complete list of BSALP correla
- Page 15 and 16: List of abbreviationsα-MEM. Alpha-
- Page 17 and 18: PCR. Polymerase chain reactionPer1
- Page 19 and 20: G2/M checkpoint. The point in the c
- Page 21 and 22: Species names13-lined ground squirr
- Page 23 and 24: Chapter One - Background and signif
- Page 25 and 26: 1.3 Bone turnover is unbalanced dur
- Page 27 and 28: pro-apoptosis regulator BAX. An imp
- Page 29 and 30: low-dose administration of parathyr
- Page 31 and 32: decrease in bone trabecular thickne
- Page 33 and 34: experience periodic arousals in whi
- Page 35 and 36: ears must have evolved a mechanism
- Page 37 and 38: 1.7.6 Hypothesis 2: OCN interacts w
- Page 39 and 40: ain, heart, and femoral muscle of h
- Page 41 and 42: Hypothesis 3a: Serum concentrations
- Page 44: were released. Behavior indicating
- Page 47 and 48: 2.3 ResultsSerum activity of the bo
- Page 49 and 50: (p
- Page 51 and 52: post-hibernation sampling in the be
- Page 53 and 54: also unclear whether ucOCN may affe
- Page 55 and 56: atios of intact to fragmented OCN m
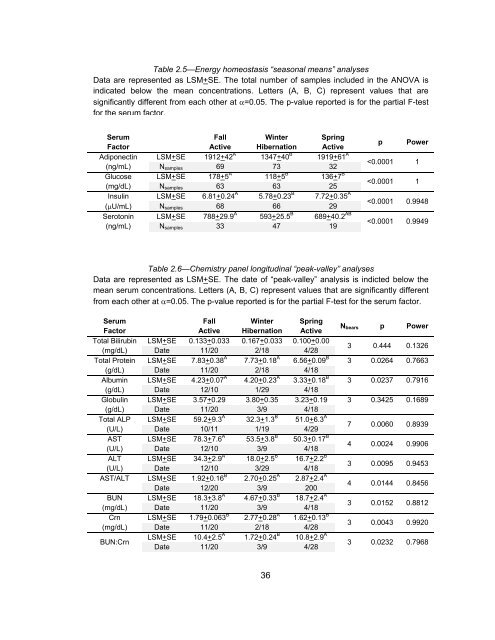
- Page 57: Table 2.3—Bone marker “seasonal
- Page 61 and 62: ABNormalized BSALPBSALP (U/L)CO N D
- Page 63 and 64: Total Calcium (mg/dL)A1.21.151.11.0
- Page 65 and 66: ABTotal OCN (ng/mL)150100500O N D J
- Page 67 and 68: Adiponectin (ng/mL)AB40003500300025
- Page 69 and 70: ABNormalized InsulinInsulin (μU/mL
- Page 71 and 72: surrounding and encompassing hibern
- Page 73 and 74: decreased from 788+30 ng/mL in preh
- Page 75 and 76: 120-122]. Most small hibernators ar
- Page 77 and 78: ears. Similarly, serum NPY increase
- Page 79 and 80: Table 3.2—Serum factor longitudin
- Page 81 and 82: Leptin (ng/mL)ABO N D J F M A M O N
- Page 83 and 84: Norepinephrine (ng/mL)A807060504030
- Page 85 and 86: IGF‐1 (ng/mL)AN D J F M A MB10009
- Page 87 and 88: 2008. Samples were collected as des
- Page 89 and 90: sampling points. It is possible to
- Page 91 and 92: C‐Terminal PTH (Relative)AB504030
- Page 93 and 94: Chapter Five — Serum from hiberna
- Page 95 and 96: Synergy HT Multi-Detection Micropla
- Page 97 and 98: gene specific primers and 12.5 μL
- Page 99 and 100: involved in the reduced caspase-3/7
- Page 101 and 102: hibernation cycles without problem
- Page 103 and 104: filtered seasonal bear serum and fo
- Page 105 and 106: which is dependent upon caspase-3 a
- Page 107 and 108: Caspase‐3/7 ActivityO N D J F M A
- Page 109 and 110:
6Caspase‐3/7 Activity54321**0Vehi
- Page 111 and 112:
ABCaspase‐3/7 Activity9876543210*
- Page 113 and 114:
eyond the G1/S checkpoint, thus ind
- Page 115 and 116:
ears, it is possible that tissue se
- Page 117 and 118:
PTH1R, RANKL, Runx2, Smurf1, TLR4,
- Page 119 and 120:
factors Runx2 and OCN also increase
- Page 121 and 122:
Table 6.3—Gene expression 3 hour
- Page 123 and 124:
Table 6.5—Gene expression 6 day d
- Page 125 and 126:
Cyclin D1 Gene ExpressionO N D J F
- Page 127 and 128:
Smurf1 Gene ExpressionO N D J F M A
- Page 129 and 130:
BAK Gene ExpressionO N D J F M A MM
- Page 131 and 132:
M‐CSF Gene ExpressionO N D J F M
- Page 133 and 134:
Per1 Gene ExpressionO N D J F M A M
- Page 135 and 136:
Akt Gene ExpressionO N D J F M A MM
- Page 137 and 138:
Bcl‐2 Gene ExpressionO N D J F M
- Page 139 and 140:
Cyclin D1 Gene ExpressionO N D J F
- Page 141 and 142:
OPN Gene ExpressionO N D J F M A MM
- Page 143 and 144:
2PTH1R Gene Expression1.510.50O N D
- Page 145 and 146:
TLR4 Gene ExpressionO N D J F M A M
- Page 147 and 148:
Bcl‐2 Gene ExpressionO N D J F M
- Page 149 and 150:
OCN Gene ExpressionO N D J F M A MM
- Page 151 and 152:
PTH1R Gene ExpressionO N D J F M A
- Page 153 and 154:
TLR4 Gene ExpressionO N D J F M A M
- Page 155 and 156:
condition in renal patients in whic
- Page 157 and 158:
hibernation. This report brings to
- Page 159 and 160:
14. Kaneps, A.J., S.M. Stover, and
- Page 161 and 162:
41. Chowdhury, I., B. Tharakan, and
- Page 163 and 164:
68. Ashe, M.C., et al., Bone geomet
- Page 165 and 166:
95. Perrien, D.S., et al., Aging al
- Page 167 and 168:
122. Lesser, R.W., et al., Renal re
- Page 169 and 170:
151. Confavreux, C.B., R.L. Levine,
- Page 171 and 172:
178. Toribara, T.Y., A.R. Terepka,
- Page 173 and 174:
206. Luo, X.H., et al., Adiponectin
- Page 175 and 176:
233. Florant, G.L., et al., Fat-cel
- Page 177 and 178:
259. Bhasin, S., et al., Older men
- Page 179 and 180:
284. Miura, M., et al., A crucial r
- Page 181 and 182:
Appendix A—Complete tables of cor
- Page 183 and 184:
Table A.5—Complete list of ionize
- Page 185 and 186:
Table A.7—Complete list of adipon
- Page 187 and 188:
Table A.12—Complete list of norep