Physical Principles of Electron Microscopy: An Introduction to TEM ...
Physical Principles of Electron Microscopy: An Introduction to TEM ...
Physical Principles of Electron Microscopy: An Introduction to TEM ...

You also want an ePaper? Increase the reach of your titles
YUMPU automatically turns print PDFs into web optimized ePapers that Google loves.
<strong>An</strong>alytical <strong>Electron</strong> <strong>Microscopy</strong> 159<br />
letter; thus K implies that nl = 1, L implies nl = 1, M implies nl = 1 and so on.<br />
This Roman symbol is followed by a Greek letter that represents the change<br />
in quantum number: � denotes (nu � nl) = 1, � denotes (nu � nl) = 2, and �<br />
denotes (nu � nl) = 3. Sometimes a numerical subscript is added <strong>to</strong> allow for<br />
the fact that some energy levels are split in<strong>to</strong> components <strong>of</strong> slightly<br />
different energy, due <strong>to</strong> quantum-mechanical effects.<br />
The transition sequence represented in Fig. 6-1b would therefore result in<br />
a K� x-ray being emitted, and in the case <strong>of</strong> carbon there is no other<br />
possibility. With an a<strong>to</strong>m <strong>of</strong> higher a<strong>to</strong>mic number, containing electrons in<br />
its M-shell, an M- <strong>to</strong> K-shell transition would result in a K� x-ray (<strong>of</strong> greater<br />
energy) being emitted. Similarly, a vacancy created (by inelastic scattering<br />
<strong>of</strong> a primary electron) in the L-shell might result in emission <strong>of</strong> an L�<br />
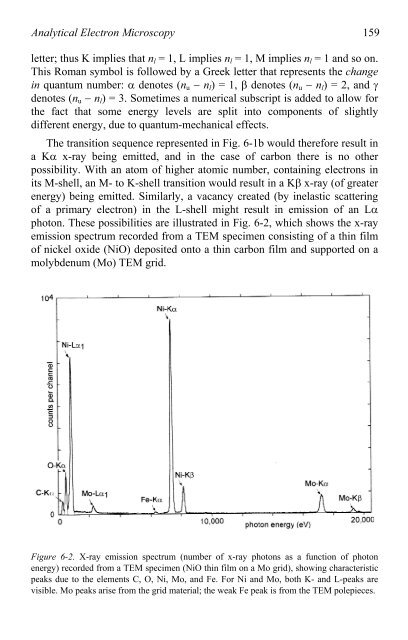
pho<strong>to</strong>n. These possibilities are illustrated in Fig. 6-2, which shows the x-ray<br />
emission spectrum recorded from a <strong>TEM</strong> specimen consisting <strong>of</strong> a thin film<br />
<strong>of</strong> nickel oxide (NiO) deposited on<strong>to</strong> a thin carbon film and supported on a<br />
molybdenum (Mo) <strong>TEM</strong> grid.<br />
Figure 6-2. X-ray emission spectrum (number <strong>of</strong> x-ray pho<strong>to</strong>ns as a function <strong>of</strong> pho<strong>to</strong>n<br />
energy) recorded from a <strong>TEM</strong> specimen (NiO thin film on a Mo grid), showing characteristic<br />
peaks due <strong>to</strong> the elements C, O, Ni, Mo, and Fe. For Ni and Mo, both K- and L-peaks are<br />
visible. Mo peaks arise from the grid material; the weak Fe peak is from the <strong>TEM</strong> polepieces.