B. Plenary session• For <strong>the</strong> calculation of life expectancy rate at kabupatenlevel, it is advisable to use data from kabupaten/kotasurvey, but <strong>the</strong> samples need to be expanded.• The calculation of index rate is greatly influenced by<strong>the</strong> maximum and minimum score.- In certain conditions, <strong>UNDP</strong> standard is to be used.- In o<strong>the</strong>r conditions, <strong>Indonesia</strong>n standard is to beused.• For education, why using only maximum score of 15,and what does <strong>the</strong> data imply?• More appropriate sanitation concept is if <strong>the</strong>measurement is related to <strong>the</strong> place for final disposal ofsolid waste.• According to <strong>the</strong> international standard, <strong>the</strong> termmorbidity refers not only to a complaint of pain andinhibition of <strong>the</strong> activity, but also <strong>the</strong> need to diagnosis<strong>the</strong> illness.• Long and healthy life should be measured not only by<strong>the</strong> life expectancy, but also by <strong>the</strong> state of prime health.HDI definition should be better described, because <strong>the</strong>change in <strong>the</strong> in HDI is very small. <strong>Human</strong> developmentshould have a more sensitive variable to showconsiderable changes.• There needs to be consideration of <strong>the</strong> presentation oftables compared each year, and if necessary <strong>the</strong> newkabupaten is returned to its original kabupaten.• Actually, HDI context is very wide, but <strong>the</strong> data to beaccommodated in <strong>the</strong> HDI are not available.• It is recommended that <strong>the</strong> presentation of BPS dataare adjusted to <strong>the</strong> schedule of Regional Budget (APBD).C. Overall resume• The editing needs to be reviewed in <strong>the</strong> aspects ofconcept, calculation method, and titles on <strong>the</strong> table.• Data accuracy, time comparison and consistency amongtables, and relevance of indicators by territory need tobe considered.• Time reference and data source are to be presentedcompletely.• Technical notes are to be completely described,concerning <strong>the</strong> pluses and minuses of <strong>the</strong> methodologyand data.• Interpretation of <strong>the</strong> indices needs to be provided.• HDI results are to be socialized first.• In addition to <strong>the</strong> data in education and health fields,o<strong>the</strong>rhealth indicators such as TBC, HIV, AIDS, etc need tobe included. If <strong>the</strong> data are available, additionalinformation on special group such as street kids andpreschooler should be included.· For <strong>the</strong> indicators to reflect <strong>the</strong> condition in <strong>the</strong> field,more Susenas samples are necessary, or a special surveythrough Suseda.D. Data sourcesThe data used in <strong>the</strong> calculation of human developmentindicators are mainly from <strong>the</strong> National SocioeconomicSurvey (Susenas). Additionally, o<strong>the</strong>r sources are usedsuch as <strong>the</strong> population census, financial statistics of <strong>the</strong>provincial government year 1999-2002 (K-1 list) andkabupaten/kota (K-2 list). The following table providesinformation on some indicators used for humandevelopment, along with <strong>the</strong> data sources.Table 1 - Sources of dataNo.IndicatorData sourceRemarks(1)(2)(3)(4)A Education1 Literacy Rate (AMH) Susenas,2002 processed2 Schooling average (MYS) Susenas,2002 processed3 School Participation Rate (APS) Susenas,2002 processed4 Drop-out Rate (DO) Susenas,2002 processedBHealth5 Life Expectancy at Birth (e 0) SP’71, SP’80, SP’90,Supas’95, SP’2000 processed6 Infant Mortality Rate (IMR) SP’71, SP’80, SP’90,Supas’95, SP’2000 processed7 People estimated to live under 40 years of age SP’71, SP’80, SP’90,Supas’95, SP’2000 processed8 Percentage of population with a health complaint Susenas,2002 processed9 Percentage of diseased people (morbidity) Susenas,2002 processed10 Average sick period Susenas,2002 processed88National <strong>Human</strong> <strong>Development</strong> <strong>Report</strong> 2004
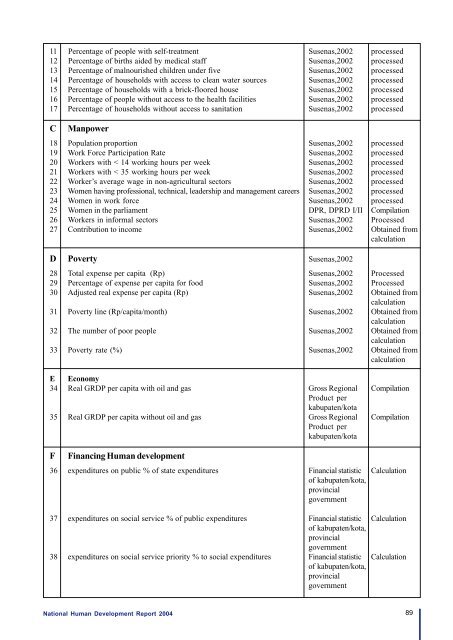
11 Percentage of people with self-treatment Susenas,2002 processed12 Percentage of births aided by medical staff Susenas,2002 processed13 Percentage of malnourished children under five Susenas,2002 processed14 Percentage of households with access to clean water sources Susenas,2002 processed15 Percentage of households with a brick-floored house Susenas,2002 processed16 Percentage of people without access to <strong>the</strong> health facilities Susenas,2002 processed17 Percentage of households without access to sanitation Susenas,2002 processedCManpower18 Population proportion Susenas,2002 processed19 Work Force Participation Rate Susenas,2002 processed20 Workers with < 14 working hours per week Susenas,2002 processed21 Workers with < 35 working hours per week Susenas,2002 processed22 Worker’s average wage in non-agricultural sectors Susenas,2002 processed23 Women having professional, technical, leadership and management careers Susenas,2002 processed24 Women in work force Susenas,2002 processed25 Women in <strong>the</strong> parliament DPR, DPRD I/II Compilation26 Workers in informal sectors Susenas,2002 Processed27 Contribution to income Susenas,2002 Obtained fromcalculationD Poverty Susenas,200228 Total expense per capita (Rp) Susenas,2002 Processed29 Percentage of expense per capita for food Susenas,2002 Processed30 Adjusted real expense per capita (Rp) Susenas,2002 Obtained fromcalculation31 Poverty line (Rp/capita/month) Susenas,2002 Obtained fromcalculation32 The number of poor people Susenas,2002 Obtained fromcalculation33 Poverty rate (%) Susenas,2002 Obtained fromcalculationE Economy34 Real GRDP per capita with oil and gas Gross Regional CompilationProduct perkabupaten/kota35 Real GRDP per capita without oil and gas Gross Regional CompilationProduct perkabupaten/kotaFFinancing <strong>Human</strong> development36 expenditures on public % of state expenditures Financial statistic Calculationof kabupaten/kota,provincialgovernment37 expenditures on social service % of public expenditures Financial statistic Calculationof kabupaten/kota,provincialgovernment38 expenditures on social service priority % to social expenditures Financial statistic Calculationof kabupaten/kota,provincialgovernmentNational <strong>Human</strong> <strong>Development</strong> <strong>Report</strong> 2004 89
- Page 2 and 3:
NationalHuman DevelopmentReport 200
- Page 4 and 5:
ForewordIndonesia has made critical
- Page 6 and 7:
AcknowledgementsThis Report is a re
- Page 8:
AbbreviationsAPBDAPBNASEANBAPPENASB
- Page 11 and 12:
TABLES2.1 - Comparison of per capit
- Page 13 and 14:
EXECUTIVE SUMMARYIndonesiaNational
- Page 15 and 16:
to meet the Millennium Development
- Page 17 and 18:
Chapter 1Indonesia in transition:To
- Page 19 and 20:
The place of human development in I
- Page 21 and 22:
Chapter 2The state of human develop
- Page 23 and 24:
Figure 2.4 - Map of human developme
- Page 25 and 26:
Figure 2.4 - Social indicators, 197
- Page 27 and 28:
of income and corporate taxes has r
- Page 29 and 30:
Figure 2.10 - GDP growth, 1990-2003
- Page 31 and 32:
Table 2.4 - Proportion of total bri
- Page 33 and 34:
In addition, the overall sense of p
- Page 35 and 36:
themselves. On this basis Indonesia
- Page 37 and 38:
Box 3.2 - Pathways to human develop
- Page 39 and 40:
Table 3.3 - Infant mortality rate a
- Page 41 and 42:
poor is a clear recognition that de
- Page 43 and 44:
educing the infant mortality rate m
- Page 45 and 46:
assuming that 1.3 trillion would co
- Page 47 and 48:
The national figure would certainly
- Page 49 and 50: expenditure. In practice, it would
- Page 51 and 52: Table 4.2 - Provincial breakdown of
- Page 53 and 54: administration, plus an allowance f
- Page 55 and 56: Figure 4.5 - Ratio of salaries of p
- Page 57 and 58: Appendix to Chapter 4Health and edu
- Page 59 and 60: The third is the ‘Special Fund’
- Page 61 and 62: Chapter 5Rethinking fiscal prioriti
- Page 63 and 64: At the very outset, however, it sho
- Page 65 and 66: enforcement particularly for person
- Page 67 and 68: Another risk from decentralization
- Page 69 and 70: Box 5.2 - Variations in poverty con
- Page 71 and 72: physical security - which contribut
- Page 73 and 74: centre, for example, played a signi
- Page 75 and 76: BibliographyAbidin, A. (2002), 1 st
- Page 77 and 78: LPEM-FEUI (2004), Draft Final Repor
- Page 79 and 80: Subbarao, K., A. Bonnerjee, J. Brai
- Page 81 and 82: HUMAN DEVELOPMENT INDICATORS AND IN
- Page 83 and 84: The human development approach brin
- Page 85 and 86: Box 2HDI, HPI-1, GDI and GEMHuman D
- Page 87 and 88: What do the human developmentindice
- Page 89 and 90: Table 1 - Districts making the grea
- Page 91 and 92: Table 2 - Districts with the highes
- Page 93 and 94: Figure 8 - GDI by province, 1999-20
- Page 95 and 96: Figure 12 - HPI by components, 1999
- Page 97 and 98: Technical workshopon human developm
- Page 99: • The percentage of households wi
- Page 103 and 104: Annex 2N a m esGROUP IIChairperson:
- Page 105 and 106: Changes in names due to the formati
- Page 107 and 108: LampungKab. Lampung Selatan (South
- Page 109 and 110: 1Human Development Index (HDI)by pr
- Page 111 and 112: 3Gender-related Development Index (
- Page 113 and 114: 5Human Poverty Index (HPI)by provin
- Page 115 and 116: ProvinceDistrictLiveexpectancy(year
- Page 117 and 118: ProvinceDistrictLiveexpectancy(year
- Page 119 and 120: ProvinceDistrictLiveexpectancy(year
- Page 121 and 122: ProvinceDistrictLiveexpectancy(year
- Page 123 and 124: ProvinceDistrictLife expectancy(yea
- Page 125 and 126: ProvinceDistrictLife expectancy(yea
- Page 127 and 128: ProvinceDistrictLife expectancy(yea
- Page 129 and 130: 8Gender Development Index (GDI)by d
- Page 131 and 132: ProvinceDistrictProportionof popula
- Page 133 and 134: ProvinceDistrictProportionof popula
- Page 135 and 136: ProvinceDistrictProportionof popula
- Page 137 and 138: 9Gender Empowerment Measure (GEM)by
- Page 139 and 140: ProvinceDistrictParticipationof wom
- Page 141 and 142: ProvinceKabupaten/KotaDistrictParti
- Page 143 and 144: ProvinceKabupaten/KotaDistrictParti
- Page 145 and 146: ProvinceDistrictParticipationof wom
- Page 147 and 148: ProvinceDistrictParticipationof wom
- Page 149 and 150: ProvinceDistrictParticipationof wom
- Page 151 and 152:
ProvinceDistrictParticipationof wom
- Page 153 and 154:
ProvinceDistrictPeople notexpected
- Page 155 and 156:
ProvinceDistrictPeople notexpected
- Page 157 and 158:
ProvinceDistrictPeople notexpected
- Page 159 and 160:
ProvinceDistrictPeople notexpected
- Page 161 and 162:
ProvinceDistrictInfantmortalityrate
- Page 163 and 164:
ProvinceDistrictInfantmortalityrate
- Page 165 and 166:
ProvinceDistrictInfantmortalityrate
- Page 167 and 168:
ProvinceDistrictInfantmortalityrate
- Page 169 and 170:
ProvinceDistrictSchool Participatio
- Page 171 and 172:
ProvinceDistrictSchool Participatio
- Page 173 and 174:
ProvinceDistrictSchool Participatio
- Page 175 and 176:
ProvinceDistrictSchool Participatio
- Page 177 and 178:
ProvinceDistrictHouseholds withacce
- Page 179 and 180:
ProvinceDistrictHouseholds withacce
- Page 181 and 182:
ProvinceDistrictHouseholds withacce
- Page 183 and 184:
ProvinceDistrictHouseholds withacce
- Page 185 and 186:
ProvinceDistrictReal per capita GRD
- Page 187 and 188:
ProvinceDistrictReal per capita GRD
- Page 189 and 190:
ProvinceDistrictReal per capita GRD
- Page 191 and 192:
ProvinceDistrictReal per capita GRD
- Page 193 and 194:
ProvinceDistrictLabourforceparticip
- Page 195 and 196:
ProvinceDistrictLabourforceparticip
- Page 197 and 198:
ProvinceDistrictLabourforceparticip
- Page 199 and 200:
ProvinceDistrictLabourforceparticip
- Page 201 and 202:
ProvinceDistrictDevelopmentexpendit
- Page 203 and 204:
ProvinceDistrictDevelopmentexpendit
- Page 205 and 206:
ProvinceDistrictDevelopmentexpendit
- Page 207 and 208:
ProvinceDistrictDevelopmentexpendit
- Page 209 and 210:
Computing the indicesThe Human Deve
- Page 211 and 212:
Calculating the HDIThis illustratio
- Page 213 and 214:
Calculating the GDIAs an example, t
- Page 215 and 216:
Definitions of Statistical TermsAcc
- Page 217:
School drop-out rate: the proportio