

Download the Indonesia Human Development Report 2004. - UNDP
Download the Indonesia Human Development Report 2004. - UNDP
Download the Indonesia Human Development Report 2004. - UNDP

You also want an ePaper? Increase the reach of your titles
YUMPU automatically turns print PDFs into web optimized ePapers that Google loves.
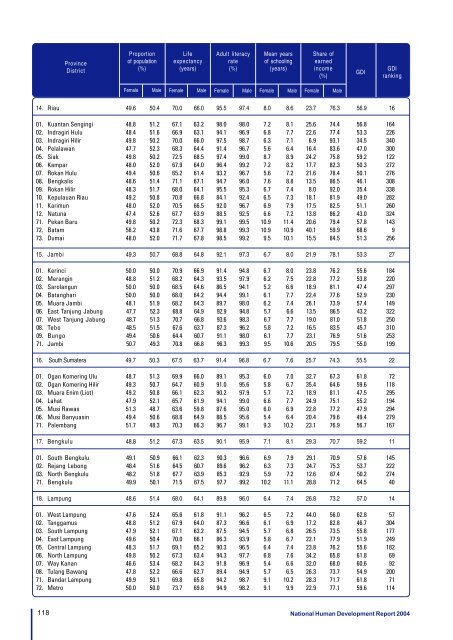
ProvinceDistrictProportionof populationLifeexpectancyAdult literacyrateMean yearsof schoolingShare ofearned(%) (years)(%)(years) incomeGDIGDI(%)rankingFemaleMaleFemale Male Female Male Female Male Female Male14. Riau 49.6 50.4 70.0 66.0 95.5 97.4 8.0 8.6 23.7 76.3 56.9 1601. Kuantan Sengingi 48.8 51.2 67.1 63.2 98.0 98.0 7.2 8.1 25.6 74.4 56.8 16402. Indragiri Hulu 48.4 51.6 66.9 63.1 94.1 96.9 6.8 7.7 22.6 77.4 53.3 22603. Indragiri Hilir 49.8 50.2 70.0 66.0 97.5 98.7 6.3 7.1 6.9 93.1 34.5 34004. Pelalawan 47.7 52.3 68.3 64.4 91.4 96.7 5.6 6.4 16.4 83.6 47.0 30005. Siak 49.8 50.2 72.5 68.5 97.4 99.0 8.7 8.9 24.2 75.8 59.2 12206. Kampar 48.0 52.0 67.9 64.0 96.4 99.2 7.2 8.2 17.7 82.3 50.3 27207. Rokan Hulu 49.4 50.6 65.2 61.4 93.2 96.7 5.6 7.2 21.6 78.4 50.1 27608. Bengkalis 48.6 51.4 71.1 67.1 94.7 96.0 7.6 8.8 13.5 86.5 46.1 30809. Rokan Hilir 48.3 51.7 68.0 64.1 95.5 95.3 6.7 7.4 8.0 92.0 35.4 33810. Kepulauan Riau 49.2 50.8 70.8 66.8 84.1 92.4 6.5 7.3 18.1 81.9 49.0 28211. Karimun 48.0 52.0 70.5 66.5 92.0 96.7 6.9 7.9 17.5 82.5 51.1 26012. Natuna 47.4 52.6 67.7 63.9 88.5 92.5 6.6 7.2 13.8 86.2 43.0 32471. Pekan Baru 49.8 50.2 72.3 68.3 99.1 99.5 10.9 11.4 20.6 79.4 57.8 14372. Batam 56.2 43.8 71.6 67.7 98.8 99.3 10.9 10.9 40.1 59.9 68.6 973. Dumai 48.0 52.0 71.7 67.8 98.5 99.2 9.5 10.1 15.5 84.5 51.3 25615. Jambi 49.3 50.7 68.8 64.8 92.1 97.3 6.7 8.0 21.9 78.1 53.3 2701. Kerinci 50.0 50.0 70.9 66.9 91.4 94.8 6.7 8.0 23.8 76.2 55.6 18402. Merangin 48.8 51.2 68.2 64.3 93.5 97.9 6.2 7.5 22.8 77.2 53.8 22003. Sarolangun 50.0 50.0 68.5 64.6 86.5 94.1 5.2 6.6 18.9 81.1 47.4 29704. Batanghari 50.0 50.0 68.0 64.2 94.4 99.1 6.1 7.7 22.4 77.6 52.9 23005. Muara Jambi 48.1 51.9 68.2 64.3 89.7 98.0 6.2 7.4 26.1 73.9 57.4 14906. East Tanjung Jabung 47.7 52.3 68.8 64.9 92.9 94.8 5.7 6.6 13.5 86.5 43.2 32207. West Tanjung Jabung 48.7 51.3 70.7 66.8 93.6 98.3 6.7 7.7 19.0 81.0 51.8 25008. Tebo 48.5 51.5 67.6 63.7 87.3 96.2 5.8 7.2 16.5 83.5 45.7 31009. Bungo 49.4 50.6 64.4 60.7 91.1 98.0 6.1 7.7 23.1 76.9 51.6 25371. Jambi 50.7 49.3 70.8 66.8 96.3 99.3 9.5 10.6 20.5 79.5 55.0 19916. South Sumatera 49.7 50.3 67.5 63.7 91.4 96.8 6.7 7.6 25.7 74.3 55.5 2201. Ogan Komering Ulu 48.7 51.3 69.9 66.0 89.1 95.3 6.0 7.0 32.7 67.3 61.8 7202. Ogan Komering Hilir 49.3 50.7 64.7 60.9 91.0 95.6 5.8 6.7 35.4 64.6 59.6 11803. Muara Enim (Liot) 49.2 50.8 66.1 62.3 90.2 97.9 5.7 7.2 18.9 81.1 47.5 29504. Lahat 47.9 52.1 65.7 61.9 94.1 99.0 6.6 7.7 24.9 75.1 55.2 19405. Musi Rawas 51.3 48.7 63.6 59.8 87.6 95.0 6.0 6.9 22.8 77.2 47.9 29406. Musi Banyuasin 49.4 50.6 68.8 64.9 88.5 95.6 5.4 6.4 20.4 79.6 49.4 27971. Palembang 51.7 48.3 70.3 66.3 96.7 99.1 9.3 10.2 23.1 76.9 56.7 16717. Bengkulu 48.8 51.2 67.3 63.5 90.1 95.9 7.1 8.1 29.3 70.7 59.2 1101. South Bengkulu 49.1 50.9 66.1 62.3 90.3 96.6 6.9 7.9 29.1 70.9 57.6 14502. Rejang Lebong 48.4 51.6 64.5 60.7 89.6 96.2 6.3 7.3 24.7 75.3 53.7 22203. North Bengkulu 48.2 51.8 67.7 63.9 85.3 92.9 5.9 7.2 12.6 87.4 50.2 27471. Bengkulu 49.9 50.1 71.5 67.5 97.7 99.2 10.2 11.1 28.8 71.2 64.5 4018. Lampung 48.6 51.4 68.0 64.1 89.8 96.0 6.4 7.4 26.8 73.2 57.0 1401. West Lampung 47.6 52.4 65.6 61.8 91.1 96.2 6.5 7.2 44.0 56.0 62.8 5702. Tanggamus 48.8 51.2 67.9 64.0 87.3 96.6 6.1 6.9 17.2 82.8 46.7 30403. South Lampung 47.9 52.1 67.1 63.2 87.5 94.5 5.7 6.8 26.5 73.5 55.8 17704. East Lampung 49.6 50.4 70.0 66.1 86.3 93.9 5.8 6.7 22.1 77.9 51.9 24905. Central Lampung 48.3 51.7 69.1 65.2 90.3 96.5 6.4 7.4 23.8 76.2 55.6 18206. North Lampung 49.8 50.2 67.3 63.4 94.3 97.7 6.8 7.6 34.2 65.8 61.8 6907. Way Kanan 46.6 53.4 68.2 64.3 91.8 96.9 5.4 6.6 32.0 68.0 60.6 9208. Tulang Bawang 47.8 52.2 66.6 62.7 89.4 94.9 5.7 6.5 26.3 73.7 54.9 20071. Bandar Lampung 49.9 50.1 69.8 65.8 94.2 98.7 9.1 10.2 28.3 71.7 61.8 7172. Metro 50.0 50.0 73.7 69.8 94.9 98.2 9.1 9.9 22.9 77.1 59.6 114118 National <strong>Human</strong> <strong>Development</strong> <strong>Report</strong> 2004


