

Download the Indonesia Human Development Report 2004. - UNDP
Download the Indonesia Human Development Report 2004. - UNDP
Download the Indonesia Human Development Report 2004. - UNDP

Create successful ePaper yourself
Turn your PDF publications into a flip-book with our unique Google optimized e-Paper software.
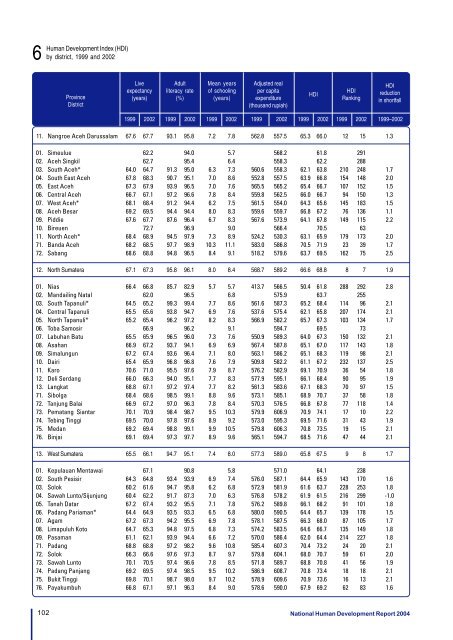
6<strong>Human</strong> <strong>Development</strong> Index (HDI)by district, 1999 and 2002ProvinceDistrictLiveexpectancy(years)Adultliteracy rate(%)Mean yearsof schooling(years)Adjusted realper capitaexpenditure(thousand rupiah)HDIHDIRankingHDIreductionin shortfall1999 2002 1999 2002 1999 2002 1999 2002 1999 2002 1999 2002 1999–200211. Nangroe Aceh Darussalam 67.6 67.7 93.1 95.8 7.2 7.8 562.8 557.5 65.3 66.0 12 15 1.301. Simeulue 62.2 94.0 5.7 568.2 61.8 29102. Aceh Singkil 62.7 95.4 6.4 558.3 62.2 28803. South Aceh* 64.0 64.7 91.3 95.0 6.3 7.3 560.6 558.3 62.1 63.8 210 248 1.704. South East Aceh 67.8 68.3 90.7 95.1 7.0 8.6 552.8 557.5 63.9 66.8 154 148 2.005. East Aceh 67.3 67.9 93.9 96.5 7.0 7.6 565.5 565.2 65.4 66.7 107 152 1.506. Central Aceh 66.7 67.1 97.2 96.6 7.8 8.4 559.8 562.5 66.0 66.7 94 150 1.307. West Aceh* 68.1 68.4 91.2 94.4 6.2 7.5 561.5 554.0 64.3 65.6 145 183 1.508. Aceh Besar 69.2 69.5 94.4 94.4 8.0 8.3 559.6 559.7 66.8 67.2 76 136 1.109. Piddie 67.6 67.7 87.6 96.4 6.7 8.3 567.6 573.9 64.1 67.8 149 115 2.210. Bireuen 72.7 96.9 9.0 566.4 70.5 6311. North Aceh* 68.4 68.9 94.5 97.9 7.3 8.9 524.2 530.3 63.1 65.9 179 173 2.071. Banda Aceh 68.2 68.5 97.7 98.9 10.3 11.1 583.0 586.8 70.5 71.9 23 39 1.772. Sabang 68.6 68.8 94.8 96.5 8.4 9.1 518.2 579.6 63.7 69.5 162 75 2.512. North Sumatera 67.1 67.3 95.8 96.1 8.0 8.4 568.7 589.2 66.6 68.8 8 7 1.901. Nias 66.4 66.8 85.7 82.9 5.7 5.7 413.7 566.5 50.4 61.8 288 292 2.802. Mandailing Natal 62.0 96.5 6.8 575.9 63.7 25503. South Tapanuli* 64.5 65.2 99.3 99.4 7.7 8.6 561.6 587.3 65.2 68.4 114 96 2.104. Central Tapanuli 65.5 65.6 93.8 94.7 6.9 7.6 537.6 575.4 62.1 65.8 207 174 2.105. North Tapanuli* 65.2 65.4 96.2 97.2 8.2 8.3 566.9 582.2 65.7 67.3 103 134 1.706. Toba Samosir 66.9 96.2 9.1 594.7 69.5 7307. Labuhan Batu 65.5 65.9 96.5 96.0 7.3 7.6 550.9 589.3 64.0 67.3 150 132 2.108. Asahan 66.9 67.2 93.7 94.1 6.9 6.9 567.4 587.8 65.1 67.0 117 143 1.809. Simalungun 67.2 67.4 93.6 96.4 7.1 8.0 563.1 586.2 65.1 68.3 119 98 2.110. Dairi 65.4 65.9 96.8 96.8 7.6 7.9 509.8 582.2 61.1 67.2 232 137 2.511. Karo 70.6 71.0 95.5 97.6 7.9 8.7 576.2 582.9 69.1 70.9 36 54 1.812. Deli Serdang 66.0 66.3 94.0 95.1 7.7 8.3 577.9 595.1 66.1 68.4 90 95 1.913. Langkat 68.8 67.1 97.2 97.4 7.7 8.2 561.3 583.6 67.1 68.3 70 97 1.571. Sibolga 68.4 68.6 98.5 99.1 8.8 9.6 573.1 585.1 68.9 70.7 37 58 1.872. Tanjung Balai 66.9 67.2 97.0 96.3 7.8 8.4 570.3 576.5 66.8 67.8 77 118 1.473. Pematang Siantar 70.1 70.9 98.4 98.7 9.5 10.3 579.9 606.9 70.9 74.1 17 10 2.274. Tebing Tinggi 69.5 70.0 97.8 97.6 8.9 9.2 573.0 595.3 69.5 71.6 31 43 1.975. Medan 69.2 69.4 98.8 99.1 9.9 10.5 579.8 606.3 70.8 73.5 19 15 2.176. Binjai 69.1 69.4 97.3 97.7 8.9 9.6 565.1 594.7 68.5 71.6 47 44 2.113. West Sumatera 65.5 66.1 94.7 95.1 7.4 8.0 577.3 589.0 65.8 67.5 9 8 1.701. Kepulauan Mentawai 67.1 90.8 5.8 571.0 64.1 23802. South Pesisir 64.3 64.8 93.4 93.9 6.9 7.4 576.0 587.1 64.4 65.9 143 170 1.603. Solok 60.2 61.6 94.7 95.8 6.2 6.8 572.9 581.9 61.6 63.7 228 253 1.804. Sawah Lunto/Sijunjung 60.4 62.2 91.7 87.3 7.0 6.3 576.8 578.2 61.9 61.5 216 299 -1.005. Tanah Datar 67.2 67.4 93.2 95.5 7.1 7.8 576.2 589.8 66.1 68.2 91 101 1.806. Padang Pariaman* 64.4 64.9 93.5 93.3 6.5 6.8 580.0 590.5 64.4 65.7 139 178 1.507. Agam 67.2 67.3 94.2 95.5 6.9 7.8 578.1 587.5 66.3 68.0 87 105 1.708. Limapuluh Koto 64.7 65.3 94.8 97.5 6.8 7.3 574.2 583.5 64.6 66.7 135 149 1.809. Pasaman 61.1 62.1 93.9 94.4 6.6 7.2 570.0 586.4 62.0 64.4 214 227 1.871. Padang 68.8 68.8 97.2 98.2 9.6 10.8 585.4 607.3 70.4 73.2 24 20 2.172. Solok 66.3 66.6 97.6 97.3 8.7 9.7 579.8 604.1 68.0 70.7 59 61 2.073. Sawah Lunto 70.1 70.5 97.4 96.6 7.8 8.5 571.8 589.7 68.8 70.8 41 56 1.974. Padang Panjang 69.2 69.5 97.4 98.5 9.5 10.2 586.9 608.7 70.8 73.4 18 18 2.175. Bukit Tinggi 69.8 70.1 98.7 98.0 9.7 10.2 578.9 609.6 70.9 73.6 16 13 2.176. Payakumbuh 66.8 67.1 97.1 96.3 8.4 9.0 578.6 590.0 67.9 69.2 62 83 1.6102 National <strong>Human</strong> <strong>Development</strong> <strong>Report</strong> 2004


