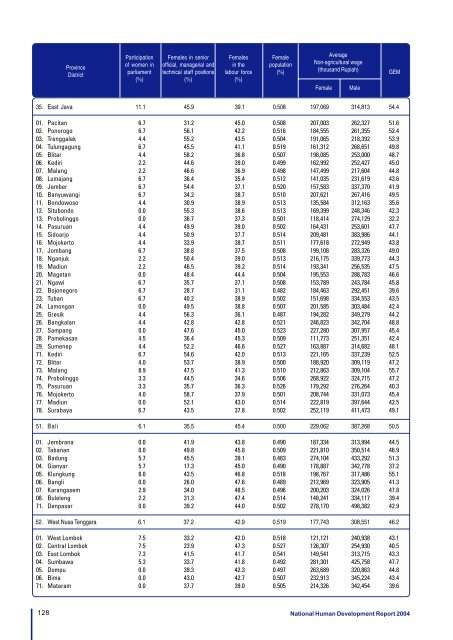
ProvinceDistrictParticipationof women inparliament(%)Females in seniorofficial, managerial andtechnical staff positions(%)Femalesin <strong>the</strong>labour force(%)Femalepopulation(%)AverageNon-agricultural wage(thousand Rupiah)FemaleMaleGEM35. East Java 11.1 45.9 39.1 0.508 197,069 314,813 54.401. Pacitan 6.7 31.2 45.0 0.508 207,003 262,327 51.602. Ponorogo 6.7 56.1 42.2 0.516 184,555 261,355 52.403. Trenggalek 4.4 55.2 43.5 0.504 191,065 218,392 53.904. Tulungagung 6.7 45.5 41.1 0.519 161,312 268,651 49.805. Blitar 4.4 58.2 36.8 0.507 198,085 253,000 48.706. Kediri 2.2 44.6 39.0 0.499 162,992 252,427 45.007. Malang 2.2 46.6 36.9 0.498 147,499 217,604 44.808. Lumajang 6.7 36.4 35.4 0.512 141,035 231,619 43.609. Jember 6.7 54.4 37.1 0.520 157,583 337,370 41.910. Banyuwangi 6.7 34.2 38.7 0.510 207,621 267,416 49.511. Bondowoso 4.4 30.9 38.9 0.513 135,584 312,163 35.612. Situbondo 0.0 55.3 38.6 0.513 169,399 248,346 42.313. Probolinggo 0.0 36.7 37.3 0.501 118,414 274,129 32.214. Pasuruan 4.4 49.9 39.0 0.502 164,431 253,601 47.715. Sidoarjo 4.4 50.9 37.7 0.514 209,481 383,986 44.116. Mojokerto 4.4 33.9 38.7 0.511 177,618 272,949 43.817. Jombang 6.7 38.8 37.5 0.508 199,108 283,326 49.018. Nganjuk 2.2 50.4 39.0 0.513 216,175 339,773 44.319. Madiun 2.2 46.5 39.2 0.514 193,341 256,535 47.520. Magetan 0.0 48.4 44.4 0.504 195,553 288,783 46.621. Ngawi 6.7 35.7 37.1 0.508 153,789 243,784 45.822. Bojonegoro 6.7 28.7 31.1 0.482 184,463 292,451 39.623. Tuban 6.7 40.2 38.9 0.502 151,698 334,553 43.524. Lamongan 0.0 49.5 38.8 0.507 201,585 303,484 42.425. Gresik 4.4 56.3 36.1 0.487 194,282 349,279 44.226. Bangkalan 4.4 42.8 42.8 0.521 246,823 342,704 48.827. Sampang 0.0 47.6 45.0 0.523 227,280 307,957 45.428. Pamekasan 4.5 36.4 45.3 0.509 111,773 251,351 42.429. Sumenep 4.4 52.2 46.6 0.527 163,887 314,682 48.171. Kediri 6.7 54.6 42.0 0.513 221,165 337,239 52.572. Blitar 4.0 53.7 38.9 0.500 188,920 309,119 47.273. Malang 8.9 47.5 41.3 0.510 212,863 309,104 55.774. Probolinggo 3.3 44.5 34.6 0.506 268,922 324,715 47.275. Pasuruan 3.3 35.7 36.3 0.526 179,292 276,264 40.376. Mojokerto 4.0 58.7 37.9 0.501 208,744 331,073 45.477. Madiun 0.0 52.1 43.0 0.514 222,819 397,644 42.578. Surabaya 6.7 43.5 37.8 0.502 252,119 411,473 49.151. Bali 6.1 35.5 45.4 0.500 229,062 387,268 50.501. Jembrana 0.0 41.9 43.8 0.490 187,334 313,994 44.502. Tabanan 0.0 49.8 45.8 0.509 221,810 350,514 46.903. Badung 5.7 45.5 39.1 0.483 274,104 433,292 51.304. Gianyar 5.7 17.3 45.0 0.490 178,887 342,778 37.205. Klungkung 8.0 43.5 46.8 0.518 198,767 317,486 55.106. Bangli 0.0 26.0 47.6 0.489 212,969 323,905 41.307. Karangasem 2.9 34.0 48.5 0.496 200,203 324,026 47.808. Buleleng 2.2 31.3 47.4 0.514 148,241 334,117 39.471. Denpasar 0.0 39.2 44.0 0.502 278,170 498,382 42.952. West Nusa Tenggara 6.1 37.2 42.9 0.519 177,743 308,551 46.201. West Lombok 7.5 33.2 42.0 0.518 121,121 240,938 43.102. Central Lombok 7.5 23.9 47.3 0.527 126,307 254,930 40.503. East Lombok 7.3 41.5 41.7 0.541 149,541 313,715 43.304. Sumbawa 5.3 33.7 41.8 0.492 281,301 425,758 47.705. Dompu 0.0 39.3 42.3 0.497 263,689 320,863 44.806. Bima 0.0 43.0 42.7 0.507 232,913 345,224 43.471. Mataram 0.0 37.7 39.0 0.505 214,326 342,454 39.6128 National <strong>Human</strong> <strong>Development</strong> <strong>Report</strong> 2004
ProvinceKabupaten/KotaDistrictParticipation PartisipasiPerempuan of women indiparliament Parlemen(%)Perempuan Females in Pekerja seniorofficial, Profesional, managerial Teknisi, andtechnical Kepemimpinan staff positions danKetatalaksanaan (%)(%)Perempuan Femalesdalam in angkatan <strong>the</strong>labour kerja force(%)Penduduk FemalePerempuan population(%)Rata-rataAverageupahNon-agriculturalNon Pertanianwage(Rp)(thousand Rupiah)Perempuan Female Male Laki-lakiGEM IDJ53. East Nusa Tenggara 2.1 35.7 43.0 0.507 233,578 304,302 46.401. West Sumba 0.0 37.5 42.9 0.497 261,669 364,810 34.402. East Sumba 0.0 33.9 40.1 0.489 193,353 278,228 40.703. Kupang 5.0 30.6 36.6 0.493 293,749 303,580 47.104. South Central Timor 5.7 30.5 32.7 0.494 189,186 292,008 34.805. North Central Timor 0.0 43.2 40.1 0.496 185,982 327,249 35.306. Belu 0.0 36.9 34.3 0.497 190,920 231,459 35.607. Alor 0.0 29.0 42.6 0.513 184,392 241,315 33.508. East Flores 0.0 35.2 50.2 0.540 176,736 237,699 40.809. Sikka 6.7 45.0 47.9 0.532 183,709 273,853 43.810. Ende 3.3 39.9 54.9 0.536 330,096 338,486 46.511. Ngada 0.0 42.6 48.4 0.522 297,139 351,901 47.412. Manggarai 0.0 26.2 48.7 0.507 222,080 301,198 41.171. Kupang 10.0 38.8 30.6 0.483 282,294 347,950 52.661. West Kalimantan 6.3 43.2 39.8 0.490 288,188 395,065 52.201. Sambas 0.0 40.7 44.3 0.488 237,586 356,182 45.002. Pontianak 0.0 51.5 37.8 0.491 301,483 382,304 44.703. Sanggau 0.0 30.2 39.3 0.489 326,583 362,308 42.004. Ketapang 0.0 51.3 36.7 0.488 295,192 333,704 45.605. Sintang 0.0 33.4 42.1 0.491 224,127 418,797 38.106. Kapuas Hulu 0.0 31.2 42.9 0.494 219,415 434,743 36.571. Pontianak 0.0 41.2 33.2 0.496 302,038 442,698 38.762. Central Kalimantan 2.5 46.3 34.9 0.488 301,149 447,841 43.301. West Kotawaringin 0.0 30.9 29.1 0.494 264,713 493,721 27.502. East Kotawaringin 3.3 42.7 28.5 0.481 302,610 453,425 39.703. Kapuas 2.2 51.3 39.9 0.489 208,598 394,915 43.204. South Barito 4.0 58.8 39.6 0.496 299,243 382,666 49.505. North Barito 0.0 43.3 36.9 0.494 430,314 452,848 45.771. Palangka Raya 4.0 49.5 33.5 0.484 383,318 471,555 49.063. South Kalimantan 8.7 47.1 41.1 0.505 281,673 395,595 55.101. Tanah Laut 3.8 52.9 38.2 0.485 246,288 361,682 48.402. Kota Baru 2.5 33.3 38.1 0.496 301,550 425,950 43.203. Banjar 5.9 57.4 41.5 0.503 259,858 379,175 51.304. Barito Kuala 3.3 50.0 43.6 0.505 311,973 378,802 52.005. Tapin 0.0 47.9 42.5 0.520 251,773 351,042 44.706. South Hulu Sungai 4.2 57.7 44.0 0.519 275,105 326,880 52.707. Central Hulu Sungai 10.0 43.0 45.0 0.512 344,059 382,589 59.708. North Hulu Sungai 3.3 46.6 47.3 0.518 221,234 289,635 51.909. Tabalong 0.0 47.2 44.7 0.515 257,685 387,923 45.271. Banjarmasin 2.2 44.0 33.0 0.499 300,742 430,851 42.664. East Kalimantan 12.5 39.2 31.0 0.491 300,643 505,083 49.301. Pasir 3.3 39.5 25.5 0.467 242,879 420,369 35.502. Kutai 2.2 37.3 31.5 0.497 382,819 578,563 38.603. Berau 0.0 43.9 32.7 0.485 298,868 475,896 37.804. Bulongan 3.3 25.6 32.3 0.471 214,015 387,356 34.571. Balikpapan 13.3 44.2 28.5 0.507 315,112 555,124 47.372. Samarinda 6.7 40.9 34.0 0.493 265,773 424,088 46.5National <strong>Human</strong> <strong>Development</strong> <strong>Report</strong> 2004129
- Page 2 and 3:
NationalHuman DevelopmentReport 200
- Page 4 and 5:
ForewordIndonesia has made critical
- Page 6 and 7:
AcknowledgementsThis Report is a re
- Page 8:
AbbreviationsAPBDAPBNASEANBAPPENASB
- Page 11 and 12:
TABLES2.1 - Comparison of per capit
- Page 13 and 14:
EXECUTIVE SUMMARYIndonesiaNational
- Page 15 and 16:
to meet the Millennium Development
- Page 17 and 18:
Chapter 1Indonesia in transition:To
- Page 19 and 20:
The place of human development in I
- Page 21 and 22:
Chapter 2The state of human develop
- Page 23 and 24:
Figure 2.4 - Map of human developme
- Page 25 and 26:
Figure 2.4 - Social indicators, 197
- Page 27 and 28:
of income and corporate taxes has r
- Page 29 and 30:
Figure 2.10 - GDP growth, 1990-2003
- Page 31 and 32:
Table 2.4 - Proportion of total bri
- Page 33 and 34:
In addition, the overall sense of p
- Page 35 and 36:
themselves. On this basis Indonesia
- Page 37 and 38:
Box 3.2 - Pathways to human develop
- Page 39 and 40:
Table 3.3 - Infant mortality rate a
- Page 41 and 42:
poor is a clear recognition that de
- Page 43 and 44:
educing the infant mortality rate m
- Page 45 and 46:
assuming that 1.3 trillion would co
- Page 47 and 48:
The national figure would certainly
- Page 49 and 50:
expenditure. In practice, it would
- Page 51 and 52:
Table 4.2 - Provincial breakdown of
- Page 53 and 54:
administration, plus an allowance f
- Page 55 and 56:
Figure 4.5 - Ratio of salaries of p
- Page 57 and 58:
Appendix to Chapter 4Health and edu
- Page 59 and 60:
The third is the ‘Special Fund’
- Page 61 and 62:
Chapter 5Rethinking fiscal prioriti
- Page 63 and 64:
At the very outset, however, it sho
- Page 65 and 66:
enforcement particularly for person
- Page 67 and 68:
Another risk from decentralization
- Page 69 and 70:
Box 5.2 - Variations in poverty con
- Page 71 and 72:
physical security - which contribut
- Page 73 and 74:
centre, for example, played a signi
- Page 75 and 76:
BibliographyAbidin, A. (2002), 1 st
- Page 77 and 78:
LPEM-FEUI (2004), Draft Final Repor
- Page 79 and 80:
Subbarao, K., A. Bonnerjee, J. Brai
- Page 81 and 82:
HUMAN DEVELOPMENT INDICATORS AND IN
- Page 83 and 84:
The human development approach brin
- Page 85 and 86:
Box 2HDI, HPI-1, GDI and GEMHuman D
- Page 87 and 88:
What do the human developmentindice
- Page 89 and 90: Table 1 - Districts making the grea
- Page 91 and 92: Table 2 - Districts with the highes
- Page 93 and 94: Figure 8 - GDI by province, 1999-20
- Page 95 and 96: Figure 12 - HPI by components, 1999
- Page 97 and 98: Technical workshopon human developm
- Page 99 and 100: • The percentage of households wi
- Page 101 and 102: 11 Percentage of people with self-t
- Page 103 and 104: Annex 2N a m esGROUP IIChairperson:
- Page 105 and 106: Changes in names due to the formati
- Page 107 and 108: LampungKab. Lampung Selatan (South
- Page 109 and 110: 1Human Development Index (HDI)by pr
- Page 111 and 112: 3Gender-related Development Index (
- Page 113 and 114: 5Human Poverty Index (HPI)by provin
- Page 115 and 116: ProvinceDistrictLiveexpectancy(year
- Page 117 and 118: ProvinceDistrictLiveexpectancy(year
- Page 119 and 120: ProvinceDistrictLiveexpectancy(year
- Page 121 and 122: ProvinceDistrictLiveexpectancy(year
- Page 123 and 124: ProvinceDistrictLife expectancy(yea
- Page 125 and 126: ProvinceDistrictLife expectancy(yea
- Page 127 and 128: ProvinceDistrictLife expectancy(yea
- Page 129 and 130: 8Gender Development Index (GDI)by d
- Page 131 and 132: ProvinceDistrictProportionof popula
- Page 133 and 134: ProvinceDistrictProportionof popula
- Page 135 and 136: ProvinceDistrictProportionof popula
- Page 137 and 138: 9Gender Empowerment Measure (GEM)by
- Page 139: ProvinceDistrictParticipationof wom
- Page 143 and 144: ProvinceKabupaten/KotaDistrictParti
- Page 145 and 146: ProvinceDistrictParticipationof wom
- Page 147 and 148: ProvinceDistrictParticipationof wom
- Page 149 and 150: ProvinceDistrictParticipationof wom
- Page 151 and 152: ProvinceDistrictParticipationof wom
- Page 153 and 154: ProvinceDistrictPeople notexpected
- Page 155 and 156: ProvinceDistrictPeople notexpected
- Page 157 and 158: ProvinceDistrictPeople notexpected
- Page 159 and 160: ProvinceDistrictPeople notexpected
- Page 161 and 162: ProvinceDistrictInfantmortalityrate
- Page 163 and 164: ProvinceDistrictInfantmortalityrate
- Page 165 and 166: ProvinceDistrictInfantmortalityrate
- Page 167 and 168: ProvinceDistrictInfantmortalityrate
- Page 169 and 170: ProvinceDistrictSchool Participatio
- Page 171 and 172: ProvinceDistrictSchool Participatio
- Page 173 and 174: ProvinceDistrictSchool Participatio
- Page 175 and 176: ProvinceDistrictSchool Participatio
- Page 177 and 178: ProvinceDistrictHouseholds withacce
- Page 179 and 180: ProvinceDistrictHouseholds withacce
- Page 181 and 182: ProvinceDistrictHouseholds withacce
- Page 183 and 184: ProvinceDistrictHouseholds withacce
- Page 185 and 186: ProvinceDistrictReal per capita GRD
- Page 187 and 188: ProvinceDistrictReal per capita GRD
- Page 189 and 190: ProvinceDistrictReal per capita GRD
- Page 191 and 192:
ProvinceDistrictReal per capita GRD
- Page 193 and 194:
ProvinceDistrictLabourforceparticip
- Page 195 and 196:
ProvinceDistrictLabourforceparticip
- Page 197 and 198:
ProvinceDistrictLabourforceparticip
- Page 199 and 200:
ProvinceDistrictLabourforceparticip
- Page 201 and 202:
ProvinceDistrictDevelopmentexpendit
- Page 203 and 204:
ProvinceDistrictDevelopmentexpendit
- Page 205 and 206:
ProvinceDistrictDevelopmentexpendit
- Page 207 and 208:
ProvinceDistrictDevelopmentexpendit
- Page 209 and 210:
Computing the indicesThe Human Deve
- Page 211 and 212:
Calculating the HDIThis illustratio
- Page 213 and 214:
Calculating the GDIAs an example, t
- Page 215 and 216:
Definitions of Statistical TermsAcc
- Page 217:
School drop-out rate: the proportio