

Download the Indonesia Human Development Report 2004. - UNDP
Download the Indonesia Human Development Report 2004. - UNDP
Download the Indonesia Human Development Report 2004. - UNDP

You also want an ePaper? Increase the reach of your titles
YUMPU automatically turns print PDFs into web optimized ePapers that Google loves.
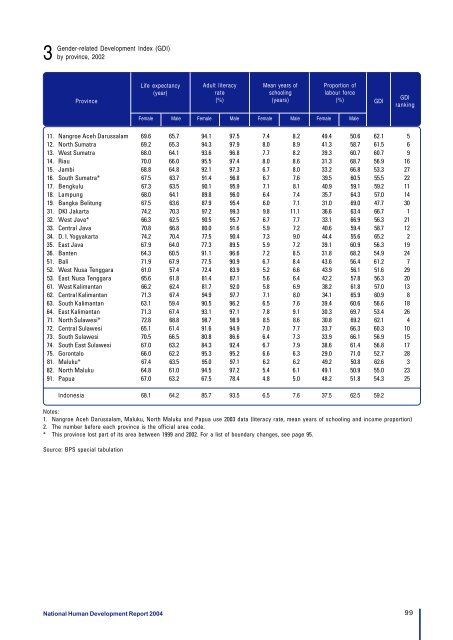
3Gender-related <strong>Development</strong> Index (GDI)by province, 2002ProvinceLife expectancy(year)Adult literacyrate(%)Mean years ofschooling(years)Proportion oflabour force(%) GDIGDIrankingFemale Male Female Male Female Male Female Male11. Nangroe Aceh Darussalam 69.6 65.7 94.1 97.5 7.4 8.2 49.4 50.6 62.1 512. North Sumatra 69.2 65.3 94.3 97.9 8.0 8.9 41.3 58.7 61.5 613. West Sumatra 68.0 64.1 93.6 96.8 7.7 8.2 39.3 60.7 60.7 914. Riau 70.0 66.0 95.5 97.4 8.0 8.6 31.3 68.7 56.9 1615. Jambi 68.8 64.8 92.1 97.3 6.7 8.0 33.2 66.8 53.3 2716. South Sumatra* 67.5 63.7 91.4 96.8 6.7 7.6 39.5 60.5 55.5 2217. Bengkulu 67.3 63.5 90.1 95.9 7.1 8.1 40.9 59.1 59.2 1118. Lampung 68.0 64.1 89.8 96.0 6.4 7.4 35.7 64.3 57.0 1419. Bangka Belitung 67.5 63.6 87.9 95.4 6.0 7.1 31.0 69.0 47.7 3031. DKI Jakarta 74.2 70.3 97.2 99.3 9.8 11.1 36.6 63.4 66.7 132. West Java* 66.3 62.5 90.5 95.7 6.7 7.7 33.1 66.9 56.3 2133. Central Java 70.8 66.8 80.0 91.6 5.9 7.2 40.6 59.4 58.7 1234. D. I. Yogyakarta 74.2 70.4 77.5 90.4 7.3 9.0 44.4 55.6 65.2 235. East Java 67.9 64.0 77.3 89.5 5.9 7.2 39.1 60.9 56.3 1936. Banten 64.3 60.5 91.1 96.6 7.2 8.5 31.8 68.2 54.9 2451. Bali 71.9 67.9 77.5 90.9 6.7 8.4 43.6 56.4 61.2 752. West Nusa Tenggara 61.0 57.4 72.4 83.9 5.2 6.6 43.9 56.1 51.6 2953. East Nusa Tenggara 65.6 61.8 81.4 87.1 5.6 6.4 42.2 57.8 56.3 2061. West Kalimantan 66.2 62.4 81.7 92.0 5.8 6.9 38.2 61.8 57.0 1362. Central Kalimantan 71.3 67.4 94.9 97.7 7.1 8.0 34.1 65.9 60.9 863. South Kalimantan 63.1 59.4 90.5 96.2 6.5 7.6 39.4 60.6 56.6 1864. East Kalimantan 71.3 67.4 93.1 97.1 7.8 9.1 30.3 69.7 53.4 2671. North Sulawesi* 72.8 68.8 98.7 98.9 8.5 8.6 30.8 69.2 62.1 472. Central Sulawesi 65.1 61.4 91.6 94.9 7.0 7.7 33.7 66.3 60.3 1073. South Sulawesi 70.5 66.5 80.8 86.6 6.4 7.3 33.9 66.1 56.9 1574. South East Sulawesi 67.0 63.2 84.3 92.4 6.7 7.9 38.6 61.4 56.8 1775. Gorontalo 66.0 62.2 95.3 95.2 6.6 6.3 29.0 71.0 52.7 2881. Maluku* 67.4 63.5 95.0 97.1 6.2 6.2 49.2 50.8 62.6 382. North Maluku 64.8 61.0 94.5 97.2 5.4 6.1 49.1 50.9 55.0 2391. Papua 67.0 63.2 67.5 78.4 4.8 5.0 48.2 51.8 54.3 25<strong>Indonesia</strong> 68.1 64.2 85.7 93.5 6.5 7.6 37.5 62.5 59.2Notes:1. Nangroe Aceh Darussalam, Maluku, North Maluku and Papua use 2003 data (literacy rate, mean years of schooling and income proportion)2. The number before each province is <strong>the</strong> official area code.* This province lost part of its area between 1999 and 2002. For a list of boundary changes, see page 95.Source: BPS special tabulationNational <strong>Human</strong> <strong>Development</strong> <strong>Report</strong> 200499


