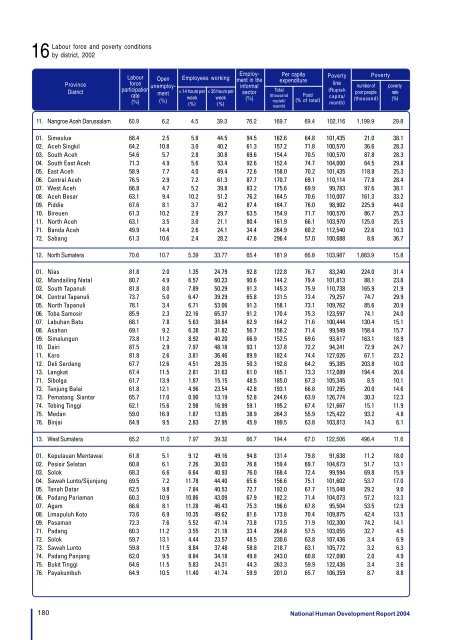
Labour force and poverty conditions16 by district, 2002ProvinceDistrictLabourforceparticipationrate(%)Openunemployment(%)Employees working< 14 hours perweek(%)< 35 hours perweek(%)Employmentin <strong>the</strong>informalsector(%)Per capitaexpenditureTotal(thousandrupiah/month)Food(% of total)Povertyline(Rupiahcapita/month)number ofpoor people(thousand)Povertypovertyrate(%)11. Nangroe Aceh Darussalam 60.9 6.2 4.5 39.3 76.2 169.7 69.4 102,116 1,199.9 29.801. Simeulue 68.4 2.5 5.8 44.5 94.5 162.6 64.8 101,435 21.0 38.102. Aceh Singkil 64.2 10.8 3.0 40.2 61.3 157.2 71.8 100,570 36.6 28.303. South Aceh 54.6 5.7 2.8 30.8 69.6 154.4 70.5 100,570 87.8 28.304. South East Aceh 71.3 4.9 5.6 53.4 92.6 152.4 74.7 104,000 64.5 29.805. East Aceh 58.9 7.7 4.0 49.4 72.6 158.0 70.2 101,435 118.8 25.306. Central Aceh 76.5 2.9 7.2 61.3 87.7 170.7 69.1 110,114 77.8 28.407. West Aceh 66.8 4.7 5.2 39.8 83.2 175.6 69.9 99,783 97.6 38.108. Aceh Besar 63.1 9.4 10.2 51.2 76.2 164.5 70.6 110,007 161.3 33.209. Piddie 67.6 8.1 3.7 40.2 87.4 164.7 76.0 98,902 225.9 44.010. Bireuen 61.3 10.2 2.9 29.7 63.5 154.9 71.7 100,570 86.7 25.311. North Aceh 63.1 3.5 3.0 21.1 80.4 161.9 66.1 103,970 125.0 25.571. Banda Aceh 49.9 14.4 2.6 24.1 34.4 264.9 60.2 112,540 22.6 10.372. Sabang 61.3 10.6 2.4 28.2 47.6 296.4 57.0 100,688 8.6 36.712. North Sumatera 70.6 10.7 5.39 33.77 65.4 181.9 66.8 103,987 1,883.9 15.801. Nias 81.8 2.0 1.35 24.79 92.8 122.8 76.7 83,240 224.0 31.402. Mandailing Natal 80.7 4.9 6.57 60.23 90.6 144.2 79.4 101,813 88.1 23.803. South Tapanuli 81.8 8.0 7.89 50.29 91.3 145.3 75.9 110,738 165.9 21.904. Central Tapanuli 73.7 5.0 6.47 39.29 65.8 131.5 73.4 79,257 74.7 29.905. North Tapanuli 78.1 3.4 6.71 53.06 91.3 158.1 73.1 109,762 85.6 20.906. Toba Samosir 85.9 2.3 22.16 65.37 91.2 170.4 75.3 123,597 74.1 24.007. Labuhan Batu 68.1 7.8 5.63 38.64 62.9 164.2 71.6 100,444 130.4 15.108. Asahan 69.1 9.2 6.38 31.82 56.7 156.2 71.4 99,549 158.4 15.709. Simalungun 73.8 11.2 8.92 40.20 66.9 152.5 69.6 93,617 163.1 18.910. Dairi 87.5 2.9 7.97 48.18 93.1 137.8 72.2 94,241 72.9 24.711. Karo 81.8 2.6 3.81 36.46 89.9 182.4 74.4 127,026 67.1 23.212. Deli Serdang 67.7 12.6 4.51 28.35 50.3 192.8 64.2 95,385 203.8 10.013. Langkat 67.4 11.5 2.81 31.63 61.0 165.1 73.3 112,089 194.4 20.671. Sibolga 61.7 13.9 1.87 15.15 48.5 185.0 67.3 105,345 8.5 10.172. Tanjung Balai 61.8 12.1 4.96 23.54 42.8 193.1 66.8 107,295 20.0 14.673. Pematang Siantar 65.7 17.0 0.90 13.19 52.8 244.6 63.9 126,774 30.3 12.374. Tebing Tinggi 62.1 15.6 2.98 16.99 59.1 195.2 67.4 121,667 15.1 11.975. Medan 59.0 16.9 1.87 13.85 38.9 264.3 55.9 125,422 93.2 4.876. Binjai 64.9 9.5 2.83 27.95 45.9 199.5 63.8 103,813 14.3 6.113. West Sumatera 65.2 11.0 7.97 39.32 66.7 194.4 67.0 122,506 496.4 11.601. Kepulauan Mentawai 61.8 5.1 9.12 49.16 94.8 131.4 79.8 91,638 11.2 18.002. Pesisir Selatan 60.8 6.1 7.26 30.03 76.8 159.4 69.7 104,673 51.7 13.103. Solok 68.3 6.6 6.64 40.93 76.0 168.4 72.4 99,594 69.8 15.904. Sawah Lunto/Sijunjung 69.5 7.2 11.78 44.40 65.6 156.6 75.1 101,602 53.7 17.005. Tanah Datar 62.5 9.8 7.84 40.53 72.7 192.0 67.7 115,048 29.2 9.006. Padang Pariaman 60.3 10.9 10.86 43.09 67.9 182.2 71.4 104,073 57.2 13.307. Agam 66.6 8.1 11.28 46.43 75.3 196.6 67.8 95,504 53.5 12.908. Limapuluh Koto 73.6 6.9 10.35 49.62 81.6 173.8 70.4 109,875 42.4 13.509. Pasaman 72.3 7.6 5.52 47.14 73.8 173.5 71.9 102,300 74.2 14.171. Padang 60.3 11.2 3.55 21.18 33.4 264.8 57.5 103,055 32.7 4.572. Solok 59.7 13.1 4.44 23.57 48.5 230.6 63.8 107,436 3.4 6.973. Sawah Lunto 59.8 11.5 8.84 37.48 58.8 218.7 63.1 105,772 3.2 6.374. Padang Panjang 62.0 9.5 8.84 34.18 49.8 243.0 60.8 127,090 2.0 4.975. Bukit Tinggi 64.6 11.5 5.83 24.31 44.3 263.3 59.9 122,436 3.4 3.676. Payakumbuh 64.9 10.5 11.40 41.74 59.9 201.0 65.7 106,359 8.7 8.8180 National <strong>Human</strong> <strong>Development</strong> <strong>Report</strong> 2004
ProvinceDistrictLabourforceparticipationrate(%)Openunemployment(%)Employees working< 14 hours perweek(%)< 35 hours perweek(%)Employmentin <strong>the</strong>informalsector(%)Per capitaexpenditureTotal(thousandrupiah/month)Food(% of total)Povertyline(Rupiahcapita/month)number ofpoor people(thousand)Povertypovertyrate(%)14. Riau 62.5 11.3 3.25 27.83 53.9 245.9 62.1 124,746 722.4 13.701. Kuantan Sengingi 62.1 10.0 6.66 65.09 78.7 166.7 76.5 128,388 64.4 27.702. Indragiri Hulu 63.8 6.4 6.50 35.33 60.4 190.2 71.6 117,914 53.2 20.603. Indragiri Hilir 64.0 5.2 1.68 36.12 84.5 179.4 74.7 129,030 107.6 18.804. Pelalawan 63.4 11.0 3.50 36.78 59.9 240.9 68.2 159,708 46.3 27.805. Siak 61.7 11.2 8.80 36.78 57.8 238.5 70.0 127,185 23.5 9.006. Kampar 61.0 9.4 6.26 42.46 63.1 209.2 68.1 126,990 77.7 15.807. Rokan Hulu 68.3 8.8 5.97 47.19 82.7 167.2 77.4 125,542 82.2 29.408. Bengkalis 60.1 10.3 2.74 30.63 58.3 225.1 61.2 117,569 67.0 12.509. Rokan Hilir 60.5 10.3 3.51 33.86 62.8 175.1 64.7 103,155 48.5 12.610. Kepulauan Riau 60.5 10.1 1.79 18.77 48.1 272.1 60.8 151,423 49.3 14.311. Karimun 61.6 10.5 2.04 21.45 44.4 274.7 56.6 112,873 9.2 6.112. Natuna 60.5 17.2 5.63 39.22 83.0 182.8 63.6 114,361 3.8 6.071. Pekan Baru 55.6 14.6 0.96 9.52 25.3 297.7 54.5 123,871 41.7 6.572. Batam 77.0 10.1 0.87 4.72 24.1 439.0 51.6 205,909 25.2 4.573. Dumai 60.5 9.9 0.24 9.39 34.0 248.7 62.2 113,223 22.9 12.615. Jambi 65.2 9.9 3.55 37.66 68.3 164.5 68.9 115,243 326.9 13.201. Kerinci 72.5 9.7 6.08 42.34 77.5 154.3 68.4 91,054 32.1 10.802. Merangin 63.9 5.4 3.18 44.02 77.1 153.2 72.6 95,957 42.1 16.003. Sarolangun 76.7 9.4 1.64 34.33 76.9 146.2 75.3 99,211 40.5 21.904. Batanghari 66.2 7.0 3.29 42.15 78.1 138.1 76.3 96,780 37.7 19.105. Muara Jambi 70.0 11.2 4.77 43.77 67.9 169.8 69.4 109,049 25.2 10.206. East Tanjung Jabung 60.9 5.8 2.49 39.04 72.1 135.4 72.5 72,846 22.3 11.907. West Tanjung Jabung 63.2 9.7 1.31 35.92 78.9 171.1 70.5 103,976 39.8 18.308. Tebo 66.1 10.4 5.45 53.16 73.5 149.4 70.2 85,046 31.4 13.609. Bungo 64.1 10.8 2.93 36.43 66.4 171.4 71.9 96,292 32.9 14.871. Jambi 56.1 11.8 2.78 14.76 33.1 209.0 59.7 88,700 23.0 5.316. South Sumatera 70.8 9.8 7.51 41.96 76.6 154.8 66.5 105,493 1,600.6 22.301. Ogan Komering Ulu 72.6 5.5 4.59 47.40 88.6 138.3 71.3 91,156 253.9 21.102. Ogan Komering Hilir 73.9 10.1 17.02 44.91 78.0 129.6 70.6 88,330 240.7 23.303. Muara Enim (Liot) 69.8 8.7 1.17 36.72 77.9 138.9 71.2 92,150 165.7 22.204. Lahat 77.4 10.7 11.95 47.63 87.0 140.5 72.3 99,338 193.2 28.205. Musi Rawas 72.1 7.7 10.14 52.02 82.8 134.1 73.3 98,917 219.1 32.906. Musi Banyuasin 71.6 6.3 6.05 44.82 84.9 118.7 73.9 91,220 381.2 28.871. Palembang 61.2 10.2 3.37 21.94 37.8 240.4 55.1 115,134 146.8 9.717. Bengkulu 75.4 10.1 5.74 29.33 78.7 154.1 65.6 101,437 372.4 22.701. South Bengkulu 74.8 13.3 8.01 35.92 88.5 120.2 73.8 91,032 140.0 36.302. Rejang Lebong 77.4 7.8 6.42 31.18 86.8 156.3 60.7 90,321 89.8 19.703. North Bengkulu 74.3 6.0 3.34 24.22 77.9 141.4 70.1 96,107 109.1 22.171. Bengkulu 61.0 17.1 5.49 24.91 45.3 214.5 60.4 108,481 33.5 11.018. Lampung 70.8 9.9 5.27 36.83 76.8 138.4 66.6 98,472 1,650.7 24.101. West Lampung 72.1 10.4 6.83 56.36 93.2 114.0 70.7 81,167 84.8 22.502. Tanggamus 69.4 9.1 5.55 31.81 85.3 137.4 66.7 93,068 191.5 23.603. South Lampung 73.8 7.8 6.79 41.36 74.5 131.7 69.4 88,721 353.9 30.404. East Lampung 70.8 9.3 5.78 32.99 85.4 130.5 69.9 99,923 273.2 30.505. Central Lampung 73.4 10.1 3.77 37.71 79.8 137.1 68.1 97,591 214.0 20.006. North Lampung 71.7 10.7 1.52 39.98 84.2 137.2 67.0 97,944 189.2 35.207. Way Kanan 77.1 11.6 5.96 39.86 85.6 115.0 74.3 90,232 118.0 33.708. Tulang Bawang 70.8 7.7 6.71 42.15 78.3 112.3 69.7 61,063 150.0 19.471. Bandar Lampung 62.6 15.1 4.35 18.76 35.4 201.1 56.3 94,002 63.5 8.372. Metro 57.6 13.7 2.15 23.20 53.0 200.8 56.7 89,406 12.5 10.4National <strong>Human</strong> <strong>Development</strong> <strong>Report</strong> 2004181
- Page 2 and 3:
NationalHuman DevelopmentReport 200
- Page 4 and 5:
ForewordIndonesia has made critical
- Page 6 and 7:
AcknowledgementsThis Report is a re
- Page 8:
AbbreviationsAPBDAPBNASEANBAPPENASB
- Page 11 and 12:
TABLES2.1 - Comparison of per capit
- Page 13 and 14:
EXECUTIVE SUMMARYIndonesiaNational
- Page 15 and 16:
to meet the Millennium Development
- Page 17 and 18:
Chapter 1Indonesia in transition:To
- Page 19 and 20:
The place of human development in I
- Page 21 and 22:
Chapter 2The state of human develop
- Page 23 and 24:
Figure 2.4 - Map of human developme
- Page 25 and 26:
Figure 2.4 - Social indicators, 197
- Page 27 and 28:
of income and corporate taxes has r
- Page 29 and 30:
Figure 2.10 - GDP growth, 1990-2003
- Page 31 and 32:
Table 2.4 - Proportion of total bri
- Page 33 and 34:
In addition, the overall sense of p
- Page 35 and 36:
themselves. On this basis Indonesia
- Page 37 and 38:
Box 3.2 - Pathways to human develop
- Page 39 and 40:
Table 3.3 - Infant mortality rate a
- Page 41 and 42:
poor is a clear recognition that de
- Page 43 and 44:
educing the infant mortality rate m
- Page 45 and 46:
assuming that 1.3 trillion would co
- Page 47 and 48:
The national figure would certainly
- Page 49 and 50:
expenditure. In practice, it would
- Page 51 and 52:
Table 4.2 - Provincial breakdown of
- Page 53 and 54:
administration, plus an allowance f
- Page 55 and 56:
Figure 4.5 - Ratio of salaries of p
- Page 57 and 58:
Appendix to Chapter 4Health and edu
- Page 59 and 60:
The third is the ‘Special Fund’
- Page 61 and 62:
Chapter 5Rethinking fiscal prioriti
- Page 63 and 64:
At the very outset, however, it sho
- Page 65 and 66:
enforcement particularly for person
- Page 67 and 68:
Another risk from decentralization
- Page 69 and 70:
Box 5.2 - Variations in poverty con
- Page 71 and 72:
physical security - which contribut
- Page 73 and 74:
centre, for example, played a signi
- Page 75 and 76:
BibliographyAbidin, A. (2002), 1 st
- Page 77 and 78:
LPEM-FEUI (2004), Draft Final Repor
- Page 79 and 80:
Subbarao, K., A. Bonnerjee, J. Brai
- Page 81 and 82:
HUMAN DEVELOPMENT INDICATORS AND IN
- Page 83 and 84:
The human development approach brin
- Page 85 and 86:
Box 2HDI, HPI-1, GDI and GEMHuman D
- Page 87 and 88:
What do the human developmentindice
- Page 89 and 90:
Table 1 - Districts making the grea
- Page 91 and 92:
Table 2 - Districts with the highes
- Page 93 and 94:
Figure 8 - GDI by province, 1999-20
- Page 95 and 96:
Figure 12 - HPI by components, 1999
- Page 97 and 98:
Technical workshopon human developm
- Page 99 and 100:
• The percentage of households wi
- Page 101 and 102:
11 Percentage of people with self-t
- Page 103 and 104:
Annex 2N a m esGROUP IIChairperson:
- Page 105 and 106:
Changes in names due to the formati
- Page 107 and 108:
LampungKab. Lampung Selatan (South
- Page 109 and 110:
1Human Development Index (HDI)by pr
- Page 111 and 112:
3Gender-related Development Index (
- Page 113 and 114:
5Human Poverty Index (HPI)by provin
- Page 115 and 116:
ProvinceDistrictLiveexpectancy(year
- Page 117 and 118:
ProvinceDistrictLiveexpectancy(year
- Page 119 and 120:
ProvinceDistrictLiveexpectancy(year
- Page 121 and 122:
ProvinceDistrictLiveexpectancy(year
- Page 123 and 124:
ProvinceDistrictLife expectancy(yea
- Page 125 and 126:
ProvinceDistrictLife expectancy(yea
- Page 127 and 128:
ProvinceDistrictLife expectancy(yea
- Page 129 and 130:
8Gender Development Index (GDI)by d
- Page 131 and 132:
ProvinceDistrictProportionof popula
- Page 133 and 134:
ProvinceDistrictProportionof popula
- Page 135 and 136:
ProvinceDistrictProportionof popula
- Page 137 and 138:
9Gender Empowerment Measure (GEM)by
- Page 139 and 140:
ProvinceDistrictParticipationof wom
- Page 141 and 142: ProvinceKabupaten/KotaDistrictParti
- Page 143 and 144: ProvinceKabupaten/KotaDistrictParti
- Page 145 and 146: ProvinceDistrictParticipationof wom
- Page 147 and 148: ProvinceDistrictParticipationof wom
- Page 149 and 150: ProvinceDistrictParticipationof wom
- Page 151 and 152: ProvinceDistrictParticipationof wom
- Page 153 and 154: ProvinceDistrictPeople notexpected
- Page 155 and 156: ProvinceDistrictPeople notexpected
- Page 157 and 158: ProvinceDistrictPeople notexpected
- Page 159 and 160: ProvinceDistrictPeople notexpected
- Page 161 and 162: ProvinceDistrictInfantmortalityrate
- Page 163 and 164: ProvinceDistrictInfantmortalityrate
- Page 165 and 166: ProvinceDistrictInfantmortalityrate
- Page 167 and 168: ProvinceDistrictInfantmortalityrate
- Page 169 and 170: ProvinceDistrictSchool Participatio
- Page 171 and 172: ProvinceDistrictSchool Participatio
- Page 173 and 174: ProvinceDistrictSchool Participatio
- Page 175 and 176: ProvinceDistrictSchool Participatio
- Page 177 and 178: ProvinceDistrictHouseholds withacce
- Page 179 and 180: ProvinceDistrictHouseholds withacce
- Page 181 and 182: ProvinceDistrictHouseholds withacce
- Page 183 and 184: ProvinceDistrictHouseholds withacce
- Page 185 and 186: ProvinceDistrictReal per capita GRD
- Page 187 and 188: ProvinceDistrictReal per capita GRD
- Page 189 and 190: ProvinceDistrictReal per capita GRD
- Page 191: ProvinceDistrictReal per capita GRD
- Page 195 and 196: ProvinceDistrictLabourforceparticip
- Page 197 and 198: ProvinceDistrictLabourforceparticip
- Page 199 and 200: ProvinceDistrictLabourforceparticip
- Page 201 and 202: ProvinceDistrictDevelopmentexpendit
- Page 203 and 204: ProvinceDistrictDevelopmentexpendit
- Page 205 and 206: ProvinceDistrictDevelopmentexpendit
- Page 207 and 208: ProvinceDistrictDevelopmentexpendit
- Page 209 and 210: Computing the indicesThe Human Deve
- Page 211 and 212: Calculating the HDIThis illustratio
- Page 213 and 214: Calculating the GDIAs an example, t
- Page 215 and 216: Definitions of Statistical TermsAcc
- Page 217: School drop-out rate: the proportio