

Download the Indonesia Human Development Report 2004. - UNDP
Download the Indonesia Human Development Report 2004. - UNDP
Download the Indonesia Human Development Report 2004. - UNDP

Create successful ePaper yourself
Turn your PDF publications into a flip-book with our unique Google optimized e-Paper software.
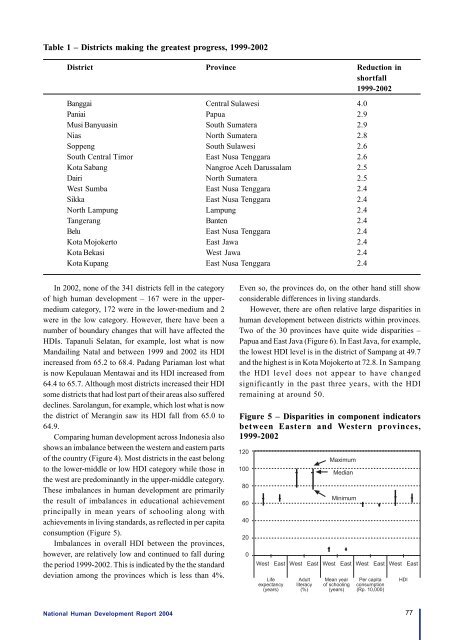
Table 1 – Districts making <strong>the</strong> greatest progress, 1999-2002District Province Reduction inshortfall1999-2002Banggai Central Sulawesi 4.0Paniai Papua 2.9Musi Banyuasin South Sumatera 2.9Nias North Sumatera 2.8Soppeng South Sulawesi 2.6South Central Timor East Nusa Tenggara 2.6Kota Sabang Nangroe Aceh Darussalam 2.5Dairi North Sumatera 2.5West Sumba East Nusa Tenggara 2.4Sikka East Nusa Tenggara 2.4North Lampung Lampung 2.4Tangerang Banten 2.4Belu East Nusa Tenggara 2.4Kota Mojokerto East Jawa 2.4Kota Bekasi West Jawa 2.4Kota Kupang East Nusa Tenggara 2.4In 2002, none of <strong>the</strong> 341 districts fell in <strong>the</strong> categoryof high human development – 167 were in <strong>the</strong> uppermediumcategory, 172 were in <strong>the</strong> lower-medium and 2were in <strong>the</strong> low category. However, <strong>the</strong>re have been anumber of boundary changes that will have affected <strong>the</strong>HDIs. Tapanuli Selatan, for example, lost what is nowMandailing Natal and between 1999 and 2002 its HDIincreased from 65.2 to 68.4. Padang Pariaman lost whatis now Kepulauan Mentawai and its HDI increased from64.4 to 65.7. Although most districts increased <strong>the</strong>ir HDIsome districts that had lost part of <strong>the</strong>ir areas also suffereddeclines. Sarolangun, for example, which lost what is now<strong>the</strong> district of Merangin saw its HDI fall from 65.0 to64.9.Comparing human development across <strong>Indonesia</strong> alsoshows an imbalance between <strong>the</strong> western and eastern partsof <strong>the</strong> country (Figure 4). Most districts in <strong>the</strong> east belongto <strong>the</strong> lower-middle or low HDI category while those in<strong>the</strong> west are predominantly in <strong>the</strong> upper-middle category.These imbalances in human development are primarily<strong>the</strong> result of imbalances in educational achievementprincipally in mean years of schooling along withachievements in living standards, as reflected in per capitaconsumption (Figure 5).Imbalances in overall HDI between <strong>the</strong> provinces,however, are relatively low and continued to fall during<strong>the</strong> period 1999-2002. This is indicated by <strong>the</strong> <strong>the</strong> standarddeviation among <strong>the</strong> provinces which is less than 4%.Even so, <strong>the</strong> provinces do, on <strong>the</strong> o<strong>the</strong>r hand still showconsiderable differences in living standards.However, <strong>the</strong>re are often relative large disparities inhuman development between districts within provinces.Two of <strong>the</strong> 30 provinces have quite wide disparities –Papua and East Java (Figure 6). In East Java, for example,<strong>the</strong> lowest HDI level is in <strong>the</strong> district of Sampang at 49.7and <strong>the</strong> highest is in Kota Mojokerto at 72.8. In Sampang<strong>the</strong> HDI level does not appear to have changedsignificantly in <strong>the</strong> past three years, with <strong>the</strong> HDIremaining at around 50.Figure 5 – Disparities in component indicatorsbetween Eastern and Western provinces,1999-2002National <strong>Human</strong> <strong>Development</strong> <strong>Report</strong> 2004 77


