

Download the Indonesia Human Development Report 2004. - UNDP
Download the Indonesia Human Development Report 2004. - UNDP
Download the Indonesia Human Development Report 2004. - UNDP

You also want an ePaper? Increase the reach of your titles
YUMPU automatically turns print PDFs into web optimized ePapers that Google loves.
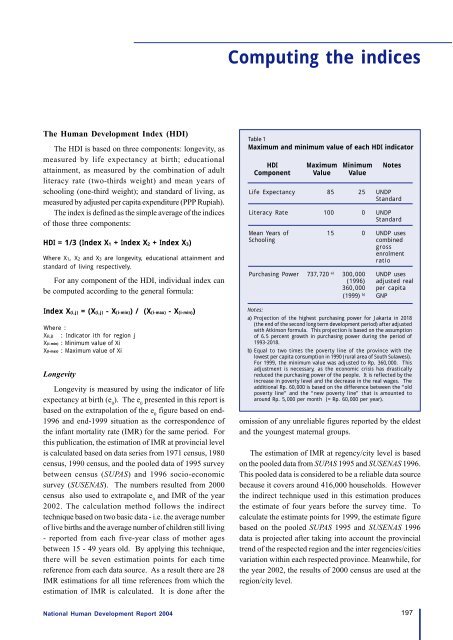
Computing <strong>the</strong> indicesThe <strong>Human</strong> <strong>Development</strong> Index (HDI)The HDI is based on three components: longevity, asmeasured by life expectancy at birth; educationalattainment, as measured by <strong>the</strong> combination of adultliteracy rate (two-thirds weight) and mean years ofschooling (one-third weight); and standard of living, asmeasured by adjusted per capita expenditure (PPP Rupiah).The index is defined as <strong>the</strong> simple average of <strong>the</strong> indicesof those three components:HDI = 1/3 (Index X1 + Index X2 + Index X3)Where X1, X2 and X3 are longevity, educational attainment andstandard of living respectively.For any component of <strong>the</strong> HDI, individual index canbe computed according to <strong>the</strong> general formula:Index X(i,j) = (X(i,j) - X(i-min)) / (X(i-max) - X(i-min))Where :X(i,j) : Indicator ith for region jX(i-min) : Minimum value of XiX(i-max) : Maximum value of XiLongevityLongevity is measured by using <strong>the</strong> indicator of lifeexpectancy at birth (e 0). The e 0presented in this report isbased on <strong>the</strong> extrapolation of <strong>the</strong> e 0figure based on end-1996 and end-1999 situation as <strong>the</strong> correspondence of<strong>the</strong> infant mortality rate (IMR) for <strong>the</strong> same period. Forthis publication, <strong>the</strong> estimation of IMR at provincial levelis calculated based on data series from 1971 census, 1980census, 1990 census, and <strong>the</strong> pooled data of 1995 surveybetween census (SUPAS) and 1996 socio-economicsurvey (SUSENAS). The numbers resulted from 2000census also used to extrapolate e 0and IMR of <strong>the</strong> year2002. The calculation method follows <strong>the</strong> indirecttechnique based on two basic data - i.e. <strong>the</strong> average numberof live births and <strong>the</strong> average number of children still living- reported from each five-year class of mo<strong>the</strong>r agesbetween 15 - 49 years old. By applying this technique,<strong>the</strong>re will be seven estimation points for each timereference from each data source. As a result <strong>the</strong>re are 28IMR estimations for all time references from which <strong>the</strong>estimation of IMR is calculated. It is done after <strong>the</strong>Table 1Maximum and minimum value of each HDI indicatorHDI Maximum Minimum NotesComponent Value ValueLife Expectancy 85 25 <strong>UNDP</strong>StandardLiteracy Rate 100 0 <strong>UNDP</strong>StandardMean Years of 15 0 <strong>UNDP</strong> usesSchoolingcombinedgrossenrolmentratioPurchasing Power 737,720 a) 300,000 <strong>UNDP</strong> uses(1996) adjusted real360,000 per capita(1999) b) GNPNotes:a) Projection of <strong>the</strong> highest purchasing power for Jakarta in 2018(<strong>the</strong> end of <strong>the</strong> second long term development period) after adjustedwith Atkinson formula. This projection is based on <strong>the</strong> assumptionof 6.5 percent growth in purchasing power during <strong>the</strong> period of1993-2018.b) Equal to two times <strong>the</strong> poverty line of <strong>the</strong> province with <strong>the</strong>lowest per capita consumption in 1990 (rural area of South Sulawesi).For 1999, <strong>the</strong> minimum value was adjusted to Rp. 360,000. Thisadjustment is necessary, as <strong>the</strong> economic crisis has drasticallyreduced <strong>the</strong> purchasing power of <strong>the</strong> people. It is reflected by <strong>the</strong>increase in poverty level and <strong>the</strong> decrease in <strong>the</strong> real wages. Theadditional Rp. 60,000 is based on <strong>the</strong> difference between <strong>the</strong> “oldpoverty line” and <strong>the</strong> “new poverty line” that is amounted toaround Rp. 5,000 per month (= Rp. 60,000 per year).omission of any unreliable figures reported by <strong>the</strong> eldestand <strong>the</strong> youngest maternal groups.The estimation of IMR at regency/city level is basedon <strong>the</strong> pooled data from SUPAS 1995 and SUSENAS 1996.This pooled data is considered to be a reliable data sourcebecause it covers around 416,000 households. However<strong>the</strong> indirect technique used in this estimation produces<strong>the</strong> estimate of four years before <strong>the</strong> survey time. Tocalculate <strong>the</strong> estimate points for 1999, <strong>the</strong> estimate figurebased on <strong>the</strong> pooled SUPAS 1995 and SUSENAS 1996data is projected after taking into account <strong>the</strong> provincialtrend of <strong>the</strong> respected region and <strong>the</strong> inter regencies/citiesvariation within each respected province. Meanwhile, for<strong>the</strong> year 2002, <strong>the</strong> results of 2000 census are used at <strong>the</strong>region/city level.National <strong>Human</strong> <strong>Development</strong> <strong>Report</strong> 2004197


