

Download the Indonesia Human Development Report 2004. - UNDP
Download the Indonesia Human Development Report 2004. - UNDP
Download the Indonesia Human Development Report 2004. - UNDP

Create successful ePaper yourself
Turn your PDF publications into a flip-book with our unique Google optimized e-Paper software.
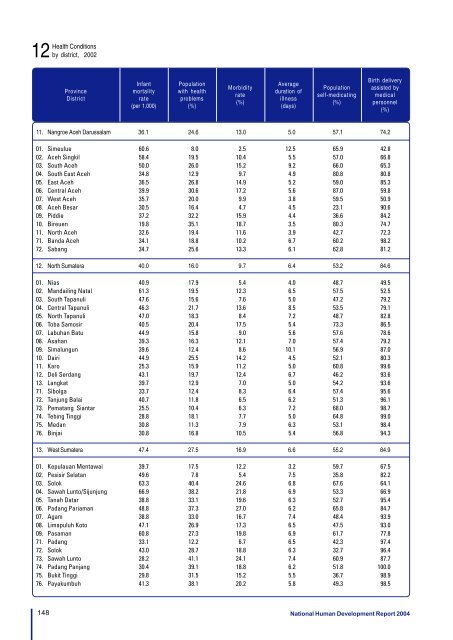
Health Conditions12 by district, 2002ProvinceDistrictInfantmortalityrate(per 1,000)Populationwith healthproblems(%)Morbidityrate(%)Averageduration ofillness(days)Populationself-medicating(%)Birth deliveryassisted bymedicalpersonnel(%)11. Nangroe Aceh Darussalam 36.1 24.6 13.0 5.0 57.1 74.201. Simeulue 60.6 8.0 2.5 12.5 65.9 42.802. Aceh Singkil 58.4 19.5 10.4 5.5 57.0 66.803. South Aceh 50.0 26.0 15.2 9.2 66.0 65.304. South East Aceh 34.8 12.9 9.7 4.9 80.8 80.805. East Aceh 36.5 26.8 14.9 5.2 59.0 85.306. Central Aceh 39.9 30.6 17.2 5.6 87.0 59.807. West Aceh 35.7 20.0 9.9 3.8 59.5 50.908. Aceh Besar 30.5 16.4 4.7 4.5 23.1 90.609. Piddie 37.2 32.2 15.9 4.4 36.6 84.210. Bireuen 19.8 35.1 18.7 3.5 80.3 74.711. North Aceh 32.6 19.4 11.6 3.9 42.7 72.371. Banda Aceh 34.1 18.8 10.2 6.7 60.2 98.272. Sabang 34.7 25.6 13.3 6.1 62.8 81.212. North Sumatera 40.0 16.0 9.7 6.4 53.2 84.601. Nias 40.9 17.9 5.4 4.0 48.7 49.502. Mandailing Natal 61.3 19.5 12.3 6.5 57.5 52.503. South Tapanuli 47.6 15.6 7.6 5.0 47.2 79.204. Central Tapanuli 46.3 21.7 13.6 8.5 53.5 79.105. North Tapanuli 47.0 18.3 8.4 7.2 48.7 82.806. Toba Samosir 40.5 20.4 17.5 5.4 73.3 86.507. Labuhan Batu 44.9 15.8 9.0 5.6 57.6 78.608. Asahan 39.3 16.3 12.1 7.0 57.4 79.209. Simalungun 39.6 12.4 8.6 10.1 56.9 87.010. Dairi 44.9 25.5 14.2 4.5 52.1 80.311. Karo 25.3 15.9 11.2 5.0 60.8 99.612. Deli Serdang 43.1 19.7 12.4 6.7 46.2 93.613. Langkat 39.7 12.9 7.0 5.0 54.2 93.671. Sibolga 33.7 12.4 8.3 6.4 57.4 95.672. Tanjung Balai 40.7 11.8 6.5 6.2 51.3 96.173. Pematang Siantar 25.5 10.4 6.3 7.2 68.0 98.774. Tebing Tinggi 28.8 18.1 7.7 5.0 64.8 99.075. Medan 30.8 11.3 7.9 6.3 53.1 98.476. Binjai 30.8 16.8 10.5 5.4 56.8 94.313. West Sumatera 47.4 27.5 16.9 6.6 55.2 84.901. Kepulauan Mentawai 39.7 17.5 12.2 3.2 59.7 67.502. Pesisir Selatan 49.6 7.8 5.4 7.5 35.8 82.203. Solok 63.3 40.4 24.6 6.8 67.6 64.104. Sawah Lunto/Sijunjung 66.9 38.2 21.8 6.9 53.3 66.905. Tanah Datar 38.8 33.1 19.6 6.3 52.7 95.406. Padang Pariaman 48.8 37.3 27.0 6.2 65.8 84.707. Agam 38.8 33.0 16.7 7.4 48.4 93.908. Limapuluh Koto 47.1 26.9 17.3 6.5 47.5 93.009. Pasaman 60.8 27.3 19.8 6.9 61.7 77.871. Padang 33.1 12.2 6.7 6.5 42.3 97.472. Solok 43.0 28.7 18.8 6.3 32.7 96.473. Sawah Lunto 28.2 41.1 24.1 7.4 60.9 87.774. Padang Panjang 30.4 39.1 18.8 6.2 51.8 100.075. Bukit Tinggi 29.8 31.5 15.2 5.5 36.7 98.976. Payakumbuh 41.3 38.1 20.2 5.8 49.3 98.5148 National <strong>Human</strong> <strong>Development</strong> <strong>Report</strong> 2004


