- Page 2 and 3:
NationalHuman DevelopmentReport 200
- Page 4 and 5:
ForewordIndonesia has made critical
- Page 6 and 7:
AcknowledgementsThis Report is a re
- Page 8:
AbbreviationsAPBDAPBNASEANBAPPENASB
- Page 11 and 12:
TABLES2.1 - Comparison of per capit
- Page 13 and 14:
EXECUTIVE SUMMARYIndonesiaNational
- Page 15 and 16:
to meet the Millennium Development
- Page 17 and 18:
Chapter 1Indonesia in transition:To
- Page 19 and 20:
The place of human development in I
- Page 21 and 22:
Chapter 2The state of human develop
- Page 23 and 24:
Figure 2.4 - Map of human developme
- Page 25 and 26:
Figure 2.4 - Social indicators, 197
- Page 27 and 28:
of income and corporate taxes has r
- Page 29 and 30:
Figure 2.10 - GDP growth, 1990-2003
- Page 31 and 32:
Table 2.4 - Proportion of total bri
- Page 33 and 34:
In addition, the overall sense of p
- Page 35 and 36:
themselves. On this basis Indonesia
- Page 37 and 38:
Box 3.2 - Pathways to human develop
- Page 39 and 40:
Table 3.3 - Infant mortality rate a
- Page 41 and 42:
poor is a clear recognition that de
- Page 43 and 44:
educing the infant mortality rate m
- Page 45 and 46:
assuming that 1.3 trillion would co
- Page 47 and 48:
The national figure would certainly
- Page 49 and 50:
expenditure. In practice, it would
- Page 51 and 52:
Table 4.2 - Provincial breakdown of
- Page 53 and 54:
administration, plus an allowance f
- Page 55 and 56:
Figure 4.5 - Ratio of salaries of p
- Page 57 and 58:
Appendix to Chapter 4Health and edu
- Page 59 and 60:
The third is the ‘Special Fund’
- Page 61 and 62:
Chapter 5Rethinking fiscal prioriti
- Page 63 and 64:
At the very outset, however, it sho
- Page 65 and 66:
enforcement particularly for person
- Page 67 and 68:
Another risk from decentralization
- Page 69 and 70:
Box 5.2 - Variations in poverty con
- Page 71 and 72:
physical security - which contribut
- Page 73 and 74:
centre, for example, played a signi
- Page 75 and 76:
BibliographyAbidin, A. (2002), 1 st
- Page 77 and 78:
LPEM-FEUI (2004), Draft Final Repor
- Page 79 and 80:
Subbarao, K., A. Bonnerjee, J. Brai
- Page 81 and 82:
HUMAN DEVELOPMENT INDICATORS AND IN
- Page 83 and 84:
The human development approach brin
- Page 85 and 86:
Box 2HDI, HPI-1, GDI and GEMHuman D
- Page 87 and 88:
What do the human developmentindice
- Page 89 and 90:
Table 1 - Districts making the grea
- Page 91 and 92:
Table 2 - Districts with the highes
- Page 93 and 94:
Figure 8 - GDI by province, 1999-20
- Page 95 and 96:
Figure 12 - HPI by components, 1999
- Page 97 and 98:
Technical workshopon human developm
- Page 99 and 100:
• The percentage of households wi
- Page 101 and 102:
11 Percentage of people with self-t
- Page 103 and 104:
Annex 2N a m esGROUP IIChairperson:
- Page 105 and 106:
Changes in names due to the formati
- Page 107 and 108:
LampungKab. Lampung Selatan (South
- Page 109 and 110:
1Human Development Index (HDI)by pr
- Page 111 and 112:
3Gender-related Development Index (
- Page 113 and 114:
5Human Poverty Index (HPI)by provin
- Page 115 and 116:
ProvinceDistrictLiveexpectancy(year
- Page 117 and 118:
ProvinceDistrictLiveexpectancy(year
- Page 119 and 120:
ProvinceDistrictLiveexpectancy(year
- Page 121 and 122:
ProvinceDistrictLiveexpectancy(year
- Page 123 and 124:
ProvinceDistrictLife expectancy(yea
- Page 125 and 126:
ProvinceDistrictLife expectancy(yea
- Page 127 and 128:
ProvinceDistrictLife expectancy(yea
- Page 129 and 130: 8Gender Development Index (GDI)by d
- Page 131 and 132: ProvinceDistrictProportionof popula
- Page 133 and 134: ProvinceDistrictProportionof popula
- Page 135 and 136: ProvinceDistrictProportionof popula
- Page 137 and 138: 9Gender Empowerment Measure (GEM)by
- Page 139 and 140: ProvinceDistrictParticipationof wom
- Page 141 and 142: ProvinceKabupaten/KotaDistrictParti
- Page 143 and 144: ProvinceKabupaten/KotaDistrictParti
- Page 145 and 146: ProvinceDistrictParticipationof wom
- Page 147 and 148: ProvinceDistrictParticipationof wom
- Page 149 and 150: ProvinceDistrictParticipationof wom
- Page 151 and 152: ProvinceDistrictParticipationof wom
- Page 153 and 154: ProvinceDistrictPeople notexpected
- Page 155 and 156: ProvinceDistrictPeople notexpected
- Page 157 and 158: ProvinceDistrictPeople notexpected
- Page 159 and 160: ProvinceDistrictPeople notexpected
- Page 161 and 162: ProvinceDistrictInfantmortalityrate
- Page 163 and 164: ProvinceDistrictInfantmortalityrate
- Page 165 and 166: ProvinceDistrictInfantmortalityrate
- Page 167 and 168: ProvinceDistrictInfantmortalityrate
- Page 169 and 170: ProvinceDistrictSchool Participatio
- Page 171 and 172: ProvinceDistrictSchool Participatio
- Page 173 and 174: ProvinceDistrictSchool Participatio
- Page 175 and 176: ProvinceDistrictSchool Participatio
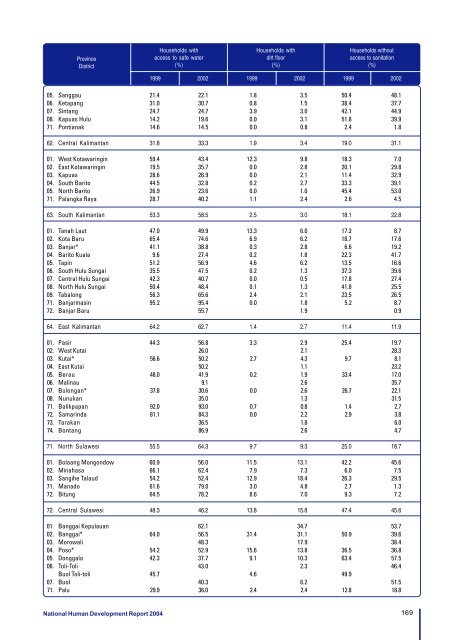
- Page 177 and 178: ProvinceDistrictHouseholds withacce
- Page 179: ProvinceDistrictHouseholds withacce
- Page 183 and 184: ProvinceDistrictHouseholds withacce
- Page 185 and 186: ProvinceDistrictReal per capita GRD
- Page 187 and 188: ProvinceDistrictReal per capita GRD
- Page 189 and 190: ProvinceDistrictReal per capita GRD
- Page 191 and 192: ProvinceDistrictReal per capita GRD
- Page 193 and 194: ProvinceDistrictLabourforceparticip
- Page 195 and 196: ProvinceDistrictLabourforceparticip
- Page 197 and 198: ProvinceDistrictLabourforceparticip
- Page 199 and 200: ProvinceDistrictLabourforceparticip
- Page 201 and 202: ProvinceDistrictDevelopmentexpendit
- Page 203 and 204: ProvinceDistrictDevelopmentexpendit
- Page 205 and 206: ProvinceDistrictDevelopmentexpendit
- Page 207 and 208: ProvinceDistrictDevelopmentexpendit
- Page 209 and 210: Computing the indicesThe Human Deve
- Page 211 and 212: Calculating the HDIThis illustratio
- Page 213 and 214: Calculating the GDIAs an example, t
- Page 215 and 216: Definitions of Statistical TermsAcc
- Page 217: School drop-out rate: the proportio