

Download the Indonesia Human Development Report 2004. - UNDP
Download the Indonesia Human Development Report 2004. - UNDP
Download the Indonesia Human Development Report 2004. - UNDP

You also want an ePaper? Increase the reach of your titles
YUMPU automatically turns print PDFs into web optimized ePapers that Google loves.
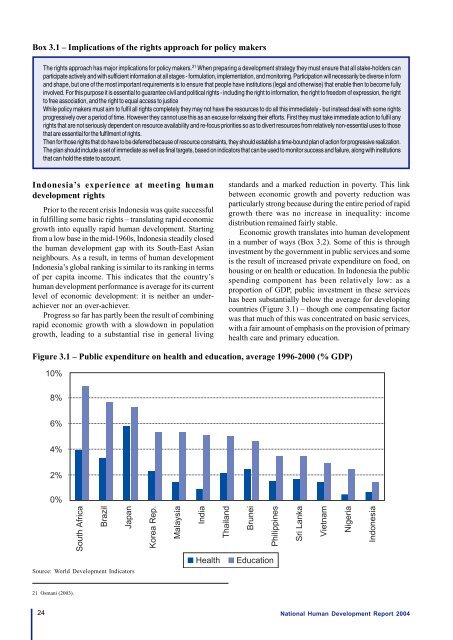
Box 3.1 – Implications of <strong>the</strong> rights approach for policy makersThe rights approach has major implications for policy makers. 21 When preparing a development strategy <strong>the</strong>y must ensure that all stake-holders canparticipate actively and with sufficient information at all stages - formulation, implementation, and monitoring. Participation will necessarily be diverse in formand shape, but one of <strong>the</strong> most important requirements is to ensure that people have institutions (legal and o<strong>the</strong>rwise) that enable <strong>the</strong>n to become fullyinvolved. For this purpose it is essential to guarantee civil and political rights - including <strong>the</strong> right to information, <strong>the</strong> right to freedom of expression, <strong>the</strong> rightto free association, and <strong>the</strong> right to equal access to justiceWhile policy makers must aim to fulfil all rights completely <strong>the</strong>y may not have <strong>the</strong> resources to do all this immediately - but instead deal with some rightsprogressively over a period of time. However <strong>the</strong>y cannot use this as an excuse for relaxing <strong>the</strong>ir efforts. First <strong>the</strong>y must take immediate action to fulfil anyrights that are not seriously dependent on resource availability and re-focus priorities so as to divert resources from relatively non-essential uses to thosethat are essential for <strong>the</strong> fulfilment of rights.Then for those rights that do have to be deferred because of resource constraints, <strong>the</strong>y should establish a time-bound plan of action for progressive realization.The plan should include a set of immediate as well as final targets, based on indicators that can be used to monitor success and failure, along with institutionsthat can hold <strong>the</strong> state to account.<strong>Indonesia</strong>’s experience at meeting humandevelopment rightsPrior to <strong>the</strong> recent crisis <strong>Indonesia</strong> was quite successfulin fulfilling some basic rights – translating rapid economicgrowth into equally rapid human development. Startingfrom a low base in <strong>the</strong> mid-1960s, <strong>Indonesia</strong> steadily closed<strong>the</strong> human development gap with its South-East Asianneighbours. As a result, in terms of human development<strong>Indonesia</strong>’s global ranking is similar to its ranking in termsof per capita income. This indicates that <strong>the</strong> country’shuman development performance is average for its currentlevel of economic development: it is nei<strong>the</strong>r an underachievernor an over-achiever.Progress so far has partly been <strong>the</strong> result of combiningrapid economic growth with a slowdown in populationgrowth, leading to a substantial rise in general livingstandards and a marked reduction in poverty. This linkbetween economic growth and poverty reduction wasparticularly strong because during <strong>the</strong> entire period of rapidgrowth <strong>the</strong>re was no increase in inequality: incomedistribution remained fairly stable.Economic growth translates into human developmentin a number of ways (Box 3.2). Some of this is throughinvestment by <strong>the</strong> government in public services and someis <strong>the</strong> result of increased private expenditure on food, onhousing or on health or education. In <strong>Indonesia</strong> <strong>the</strong> publicspending component has been relatively low: as aproportion of GDP, public investment in <strong>the</strong>se serviceshas been substantially below <strong>the</strong> average for developingcountries (Figure 3.1) – though one compensating factorwas that much of this was concentrated on basic services,with a fair amount of emphasis on <strong>the</strong> provision of primaryhealth care and primary education.Figure 3.1 – Public expenditure on health and education, average 1996-2000 (% GDP)Source: World <strong>Development</strong> Indicators21 Osmani (2003).24National <strong>Human</strong> <strong>Development</strong> <strong>Report</strong> 2004


