

Download the Indonesia Human Development Report 2004. - UNDP
Download the Indonesia Human Development Report 2004. - UNDP
Download the Indonesia Human Development Report 2004. - UNDP

Create successful ePaper yourself
Turn your PDF publications into a flip-book with our unique Google optimized e-Paper software.
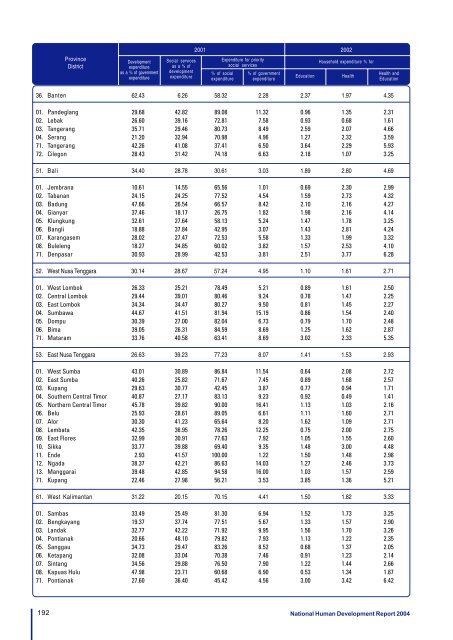
ProvinceDistrict<strong>Development</strong>expenditureas a % of governmentexpenditureSocial servicesas a % ofdevelopmentexpenditure2001 2002Expenditure for prioritysocial services% of socialexpenditure% of governmentexpenditureEducationHousehold expenditure % forHealthHealth andEducation36. Banten 62.43 6.26 58.32 2.28 2.37 1.97 4.3501. Pandeglang 29.68 42.82 89.08 11.32 0.96 1.35 2.3102. Lebak 26.60 39.16 72.81 7.58 0.93 0.68 1.6103. Tangerang 35.71 29.46 80.73 8.49 2.59 2.07 4.6604. Serang 21.20 32.94 70.98 4.96 1.27 2.32 3.5971. Tangerang 42.26 41.08 37.41 6.50 3.64 2.29 5.9372. Cilegon 28.43 31.42 74.18 6.63 2.18 1.07 3.2551. Bali 34.40 28.78 30.61 3.03 1.89 2.80 4.6901. Jembrana 10.61 14.55 65.56 1.01 0.69 2.30 2.9902. Tabanan 24.15 24.25 77.52 4.54 1.59 2.73 4.3203. Badung 47.66 26.54 66.57 8.42 2.10 2.16 4.2704. Gianyar 37.46 18.17 26.75 1.82 1.98 2.16 4.1405. Klungkung 32.61 27.64 58.13 5.24 1.47 1.78 3.2506. Bangli 18.88 37.84 42.95 3.07 1.43 2.81 4.2407. Karangasem 28.02 27.47 72.53 5.58 1.33 1.99 3.3208. Buleleng 18.27 34.85 60.02 3.82 1.57 2.53 4.1071. Denpasar 30.93 28.99 42.53 3.81 2.51 3.77 6.2852. West Nusa Tenggara 30.14 28.67 57.24 4.95 1.10 1.61 2.7101. West Lombok 26.33 25.21 78.49 5.21 0.89 1.61 2.5002. Central Lombok 29.44 39.01 80.46 9.24 0.78 1.47 2.2503. East Lombok 34.34 34.47 80.27 9.50 0.81 1.45 2.2704. Sumbawa 44.67 41.51 81.94 15.19 0.86 1.54 2.4005. Dompu 30.39 27.00 82.04 6.73 0.79 1.70 2.4806. Bima 39.05 26.31 84.59 8.69 1.25 1.62 2.8771. Mataram 33.76 40.58 63.41 8.69 3.02 2.33 5.3553. East Nusa Tenggara 26.63 39.23 77.23 8.07 1.41 1.53 2.9301. West Sumba 43.01 30.89 86.84 11.54 0.64 2.08 2.7202. East Sumba 40.26 25.82 71.67 7.45 0.89 1.68 2.5703. Kupang 29.63 30.77 42.45 3.87 0.77 0.94 1.7104. Sou<strong>the</strong>rn Central Timor 40.87 27.17 83.13 9.23 0.92 0.49 1.4105. Nor<strong>the</strong>rn Central Timor 45.78 39.82 90.00 16.41 1.13 1.03 2.1606. Belu 25.93 28.61 89.05 6.61 1.11 1.60 2.7107. Alor 30.30 41.23 65.64 8.20 1.62 1.09 2.7108. Lembata 42.35 36.95 78.26 12.25 0.75 2.00 2.7509. East Flores 32.99 30.91 77.63 7.92 1.05 1.55 2.6010. Sikka 33.77 39.88 69.40 9.35 1.48 3.00 4.4811. Ende 2.93 41.57 100.00 1.22 1.50 1.48 2.9812. Ngada 38.37 42.21 86.63 14.03 1.27 2.46 3.7313. Manggarai 39.48 42.85 94.58 16.00 1.03 1.57 2.5971. Kupang 22.46 27.98 56.21 3.53 3.85 1.36 5.2161. West Kalimantan 31.22 20.15 70.15 4.41 1.50 1.82 3.3301. Sambas 33.49 25.49 81.30 6.94 1.52 1.73 3.2502. Bengkayang 19.37 37.74 77.51 5.67 1.33 1.57 2.9003. Landak 32.77 42.22 71.92 9.95 1.56 1.70 3.2604. Pontianak 20.66 48.10 79.82 7.93 1.13 1.22 2.3505. Sanggau 34.73 29.47 83.26 8.52 0.68 1.37 2.0506. Ketapang 32.08 33.04 70.38 7.46 0.91 1.23 2.1407. Sintang 34.56 29.88 76.50 7.90 1.22 1.44 2.6608. Kapuas Hulu 47.98 23.71 60.68 6.90 0.53 1.34 1.8771. Pontianak 27.60 36.40 45.42 4.56 3.00 3.42 6.42192 National <strong>Human</strong> <strong>Development</strong> <strong>Report</strong> 2004


