

Download the Indonesia Human Development Report 2004. - UNDP
Download the Indonesia Human Development Report 2004. - UNDP
Download the Indonesia Human Development Report 2004. - UNDP

Create successful ePaper yourself
Turn your PDF publications into a flip-book with our unique Google optimized e-Paper software.
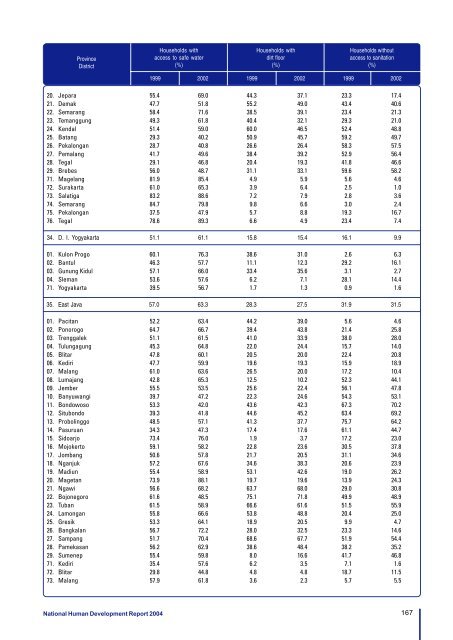
ProvinceDistrictHouseholds withaccess to safe water(%)Households withdirt floor(%)Households withoutaccess to sanitation(%)1999 20021999 2002 1999 200220. Jepara 55.4 69.0 44.3 37.1 23.3 17.421. Demak 47.7 51.8 55.2 49.0 43.4 40.622. Semarang 58.4 71.6 38.5 39.1 23.4 21.323. Temanggung 49.3 61.8 40.4 32.1 29.3 21.024. Kendal 51.4 59.0 60.0 46.5 52.4 48.825. Batang 29.3 40.2 50.9 45.7 59.2 49.726. Pekalongan 28.7 40.8 26.6 26.4 58.3 57.527. Pemalang 41.7 49.6 38.4 39.2 52.9 56.428. Tegal 29.1 46.8 20.4 19.3 41.8 46.629. Brebes 56.0 48.7 31.1 33.1 59.6 58.271. Magelang 81.9 85.4 4.9 5.9 5.6 4.672. Surakarta 61.0 65.3 3.9 6.4 2.5 1.073. Salatiga 83.2 88.6 7.2 7.9 2.8 3.674. Semarang 84.7 79.8 9.8 6.6 3.0 2.475. Pekalongan 37.5 47.9 5.7 8.8 19.3 16.776. Tegal 78.6 89.3 6.6 4.9 23.4 7.434. D. I. Yogyakarta 51.1 61.1 15.8 15.4 16.1 9.901. Kulon Progo 60.1 76.3 38.6 31.0 2.6 6.302. Bantul 46.3 57.7 11.1 12.3 29.2 16.103. Gunung Kidul 57.1 66.0 33.4 35.6 3.1 2.704. Sleman 53.6 57.6 6.2 7.1 28.1 14.471. Yogyakarta 39.5 56.7 1.7 1.3 0.9 1.635. East Java 57.0 63.3 28.3 27.5 31.9 31.501. Pacitan 52.2 63.4 44.2 39.0 5.6 4.602. Ponorogo 64.7 66.7 39.4 43.8 21.4 25.803. Trenggalek 51.1 61.5 41.0 33.9 38.0 28.004. Tulungagung 45.3 64.8 22.0 24.4 15.7 14.005. Blitar 47.8 60.1 20.5 20.0 22.4 20.806. Kediri 47.7 59.9 19.6 19.3 15.9 18.907. Malang 61.0 63.6 26.5 20.0 17.2 10.408. Lumajang 42.8 65.3 12.5 10.2 52.3 44.109. Jember 55.5 53.5 25.6 22.4 56.1 47.810. Banyuwangi 39.7 47.2 22.3 24.6 54.3 53.111. Bondowoso 53.3 42.0 43.6 42.3 67.3 70.212. Situbondo 39.3 41.8 44.6 45.2 63.4 69.213. Probolinggo 48.5 57.1 41.3 37.7 75.7 64.214. Pasuruan 34.3 47.3 17.4 17.6 61.1 44.715. Sidoarjo 73.4 76.0 1.9 3.7 17.2 23.016. Mojokerto 59.1 58.2 22.8 23.6 30.5 37.817. Jombang 50.6 57.8 21.7 20.5 31.1 34.618. Nganjuk 57.2 67.6 34.6 38.3 20.6 23.919. Madiun 55.4 58.9 53.1 42.6 19.0 26.220. Magetan 73.9 88.1 19.7 19.6 13.9 24.321. Ngawi 56.6 68.2 63.7 68.0 29.0 30.822. Bojonegoro 61.6 48.5 75.1 71.8 49.9 48.923. Tuban 61.5 58.9 66.6 61.6 51.5 55.924. Lamongan 55.8 66.6 53.8 48.8 20.4 25.025. Gresik 53.3 64.1 18.9 20.5 9.9 4.726. Bangkalan 56.7 72.2 28.0 32.5 23.3 14.627. Sampang 51.7 70.4 68.6 67.7 51.9 54.428. Pamekasan 56.2 62.9 38.6 48.4 38.2 35.229. Sumenep 55.4 59.8 8.0 16.6 41.7 46.871. Kediri 35.4 57.6 6.2 3.5 7.1 1.672. Blitar 29.8 44.8 4.8 4.8 18.7 11.573. Malang 57.9 61.8 3.6 2.3 5.7 5.5National <strong>Human</strong> <strong>Development</strong> <strong>Report</strong> 2004167


