

Download the Indonesia Human Development Report 2004. - UNDP
Download the Indonesia Human Development Report 2004. - UNDP
Download the Indonesia Human Development Report 2004. - UNDP

Create successful ePaper yourself
Turn your PDF publications into a flip-book with our unique Google optimized e-Paper software.
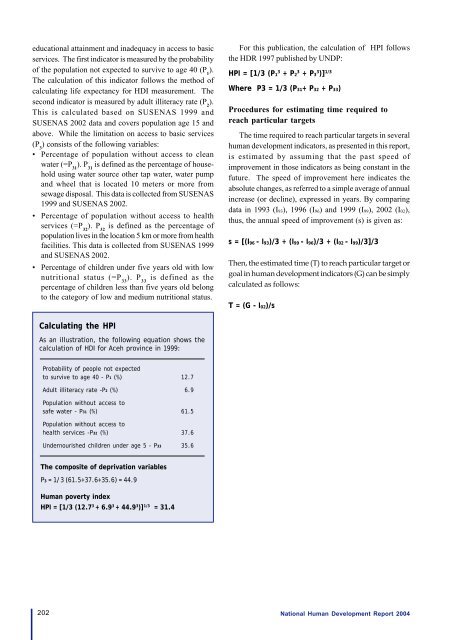
educational attainment and inadequacy in access to basicservices. The first indicator is measured by <strong>the</strong> probabilityof <strong>the</strong> population not expected to survive to age 40 (P 1).The calculation of this indicator follows <strong>the</strong> method ofcalculating life expectancy for HDI measurement. Thesecond indicator is measured by adult illiteracy rate (P 2).This is calculated based on SUSENAS 1999 andSUSENAS 2002 data and covers population age 15 andabove. While <strong>the</strong> limitation on access to basic services(P 3) consists of <strong>the</strong> following variables:• Percentage of population without access to cleanwater (=P 31). P 31is defined as <strong>the</strong> percentage of householdusing water source o<strong>the</strong>r tap water, water pumpand wheel that is located 10 meters or more fromsewage disposal. This data is collected from SUSENAS1999 and SUSENAS 2002.• Percentage of population without access to healthservices (=P 32). P 32is defined as <strong>the</strong> percentage ofpopulation lives in <strong>the</strong> location 5 km or more from healthfacilities. This data is collected from SUSENAS 1999and SUSENAS 2002.• Percentage of children under five years old with lownutritional status (=P 33). P 33is defined as <strong>the</strong>percentage of children less than five years old belongto <strong>the</strong> category of low and medium nutritional status.For this publication, <strong>the</strong> calculation of HPI follows<strong>the</strong> HDR 1997 published by <strong>UNDP</strong>:HPI = [1/3 (P1 3 + P2 3 + P3 3 )] 1/3Where P3 = 1/3 (P31+ P32 + P33)Procedures for estimating time required toreach particular targetsThe time required to reach particular targets in severalhuman development indicators, as presented in this report,is estimated by assuming that <strong>the</strong> past speed ofimprovement in those indicators as being constant in <strong>the</strong>future. The speed of improvement here indicates <strong>the</strong>absolute changes, as referred to a simple average of annualincrease (or decline), expressed in years. By comparingdata in 1993 (I93), 1996 (I96) and 1999 (I99), 2002 (I02),thus, <strong>the</strong> annual speed of improvement (s) is given as:s = [(I96 - I93)/3 + (I99 - I96)/3 + (I02 - I99)/3]/3Then, <strong>the</strong> estimated time (T) to reach particular target orgoal in human development indicators (G) can be simplycalculated as follows:T = (G - I02)/sCalculating <strong>the</strong> HPIAs an illustration, <strong>the</strong> following equation shows <strong>the</strong>calculation of HDI for Aceh province in 1999:Probability of people not expectedto survive to age 40 - P1 (%) 12.7Adult illiteracy rate -P2 (%) 6.9Population without access tosafe water - P31 (%) 61.5Population without access tohealth services -P32 (%) 37.6Undernourished children under age 5 - P33 35.6The composite of deprivation variablesP3 = 1/3 (61.5+37.6+35.6) = 44.9<strong>Human</strong> poverty indexHPI = [1/3 (12.7 3 + 6.9 3 + 44.9 3 )] 1/3 = 31.4202 National <strong>Human</strong> <strong>Development</strong> <strong>Report</strong> 2004


