

Download the Indonesia Human Development Report 2004. - UNDP
Download the Indonesia Human Development Report 2004. - UNDP
Download the Indonesia Human Development Report 2004. - UNDP

Create successful ePaper yourself
Turn your PDF publications into a flip-book with our unique Google optimized e-Paper software.
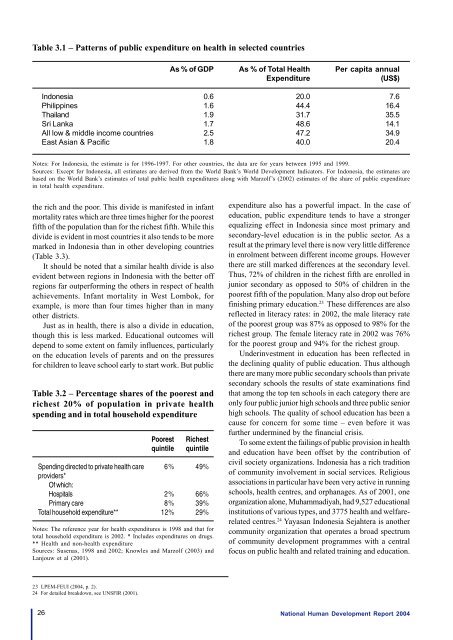
Table 3.1 – Patterns of public expenditure on health in selected countriesAs % of GDPAs % of Total HealthExpenditurePer capita annual(US$)<strong>Indonesia</strong>PhilippinesThailandSri LankaAll low & middle income countriesEast Asian & Pacific0.61.61.91.72.51.820.044.431.748.647.240.07.616.435.514.134.920.4Notes: For <strong>Indonesia</strong>, <strong>the</strong> estimate is for 1996-1997. For o<strong>the</strong>r countries, <strong>the</strong> data are for years between 1995 and 1999.Sources: Except for <strong>Indonesia</strong>, all estimates are derived from <strong>the</strong> World Bank’s World <strong>Development</strong> Indicators. For <strong>Indonesia</strong>, <strong>the</strong> estimates arebased on <strong>the</strong> World Bank’s estimates of total public health expenditures along with Marzolf’s (2002) estimates of <strong>the</strong> share of public expenditurein total health expenditure.<strong>the</strong> rich and <strong>the</strong> poor. This divide is manifested in infantmortality rates which are three times higher for <strong>the</strong> poorestfifth of <strong>the</strong> population than for <strong>the</strong> richest fifth. While thisdivide is evident in most countries it also tends to be moremarked in <strong>Indonesia</strong> than in o<strong>the</strong>r developing countries(Table 3.3).It should be noted that a similar health divide is alsoevident between regions in <strong>Indonesia</strong> with <strong>the</strong> better offregions far outperforming <strong>the</strong> o<strong>the</strong>rs in respect of healthachievements. Infant mortality in West Lombok, forexample, is more than four times higher than in manyo<strong>the</strong>r districts.Just as in health, <strong>the</strong>re is also a divide in education,though this is less marked. Educational outcomes willdepend to some extent on family influences, particularlyon <strong>the</strong> education levels of parents and on <strong>the</strong> pressuresfor children to leave school early to start work. But publicTable 3.2 – Percentage shares of <strong>the</strong> poorest andrichest 20% of population in private healthspending and in total household expenditureSpending directed to private health careproviders*Of which:HospitalsPrimary careTotal household expenditure**Poorestquintile6%2%8%12%Richestquintile49%66%39%29%Notes: The reference year for health expenditures is 1998 and that fortotal household expenditure is 2002. * Includes expenditures on drugs.** Health and non-health expenditureSources: Susenas, 1998 and 2002; Knowles and Marzolf (2003) andLanjouw et al (2001).expenditure also has a powerful impact. In <strong>the</strong> case ofeducation, public expenditure tends to have a strongerequalizing effect in <strong>Indonesia</strong> since most primary andsecondary-level education is in <strong>the</strong> public sector. As aresult at <strong>the</strong> primary level <strong>the</strong>re is now very little differencein enrolment between different income groups. However<strong>the</strong>re are still marked differences at <strong>the</strong> secondary level.Thus, 72% of children in <strong>the</strong> richest fifth are enrolled injunior secondary as opposed to 50% of children in <strong>the</strong>poorest fifth of <strong>the</strong> population. Many also drop out beforefinishing primary education. 23 These differences are alsoreflected in literacy rates: in 2002, <strong>the</strong> male literacy rateof <strong>the</strong> poorest group was 87% as opposed to 98% for <strong>the</strong>richest group. The female literacy rate in 2002 was 76%for <strong>the</strong> poorest group and 94% for <strong>the</strong> richest group.Underinvestment in education has been reflected in<strong>the</strong> declining quality of public education. Thus although<strong>the</strong>re are many more public secondary schools than privatesecondary schools <strong>the</strong> results of state examinations findthat among <strong>the</strong> top ten schools in each category <strong>the</strong>re areonly four public junior high schools and three public seniorhigh schools. The quality of school education has been acause for concern for some time – even before it wasfur<strong>the</strong>r undermined by <strong>the</strong> financial crisis.To some extent <strong>the</strong> failings of public provision in healthand education have been offset by <strong>the</strong> contribution ofcivil society organizations. <strong>Indonesia</strong> has a rich traditionof community involvement in social services. Religiousassociations in particular have been very active in runningschools, health centres, and orphanages. As of 2001, oneorganization alone, Muhammadiyah, had 9,527 educationalinstitutions of various types, and 3775 health and welfarerelatedcentres. 24 Yayasan <strong>Indonesia</strong> Sejahtera is ano<strong>the</strong>rcommunity organization that operates a broad spectrumof community development programmes with a centralfocus on public health and related training and education.23 LPEM-FEUI (2004, p. 2).24 For detailed breakdown, see UNSFIR (2001).26National <strong>Human</strong> <strong>Development</strong> <strong>Report</strong> 2004


