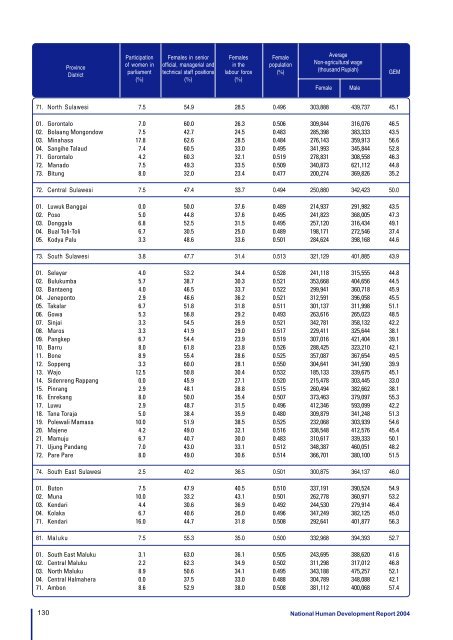
ProvinceKabupaten/KotaDistrictParticipation PartisipasiPerempuan of women indiparliament Parlemen(%)Perempuan Females in Pekerja seniorofficial, Profesional, managerial Teknisi, andtechnical Kepemimpinan staff positions danKetatalaksanaan (%)(%)Perempuan Femalesdalam in angkatan <strong>the</strong>labour kerja force(%)Penduduk FemalePerempuan population(%)Rata-rataAverageupahNon-agriculturalNon Pertanianwage(Rp)(thousand Rupiah)Perempuan Female Male Laki-lakiGEM IDJ71. North Sulawesi 7.5 54.9 28.5 0.496 303,888 439,737 45.101. Gorontalo 7.0 60.0 26.3 0.506 309,844 316,076 46.502. Bolaang Mongondow 7.5 42.7 24.5 0.483 285,398 383,333 43.503. Minahasa 17.8 62.6 28.5 0.484 276,143 359,913 56.604. Sangihe Talaud 7.4 60.5 33.0 0.495 341,993 345,844 52.871. Gorontalo 4.2 60.3 32.1 0.519 278,831 308,558 46.372. Manado 7.5 49.3 33.5 0.509 340,873 621,112 44.873. Bitung 8.0 32.0 23.4 0.477 200,274 369,826 35.272. Central Sulawesi 7.5 47.4 33.7 0.494 250,880 342,423 50.001. Luwuk Banggai 0.0 50.0 37.6 0.489 214,937 291,982 43.502. Poso 5.0 44.8 37.6 0.495 241,823 368,005 47.303. Donggala 6.8 52.5 31.5 0.495 257,120 316,434 49.104. Bual Toli-Toli 6.7 30.5 25.0 0.489 198,171 272,546 37.405. Kodya Palu 3.3 48.6 33.6 0.501 284,624 398,168 44.673. South Sulawesi 3.8 47.7 31.4 0.513 321,129 401,885 43.901. Selayar 4.0 53.2 34.4 0.528 241,118 315,555 44.802. Bulukumba 5.7 38.7 30.3 0.521 353,668 404,656 44.503. Bantaeng 4.0 46.5 33.7 0.522 299,941 360,718 45.904. Jeneponto 2.9 46.6 36.2 0.521 312,591 396,058 45.505. Takalar 6.7 51.8 31.8 0.511 301,137 311,998 51.106. Gowa 5.3 56.8 29.2 0.493 263,616 265,023 48.507. Sinjai 3.3 54.5 26.9 0.521 342,781 358,132 42.208. Maros 3.3 41.9 29.0 0.517 229,411 325,644 38.109. Pangkep 6.7 54.4 23.9 0.519 307,016 421,404 39.110. Barru 8.0 61.8 23.8 0.526 288,425 323,210 42.111. Bone 8.9 55.4 28.6 0.525 357,087 367,654 49.512. Soppeng 3.3 60.0 28.1 0.550 304,641 341,590 39.913. Wajo 12.5 50.8 30.4 0.532 185,133 339,675 45.114. Sidenreng Rappang 0.0 45.9 27.1 0.520 215,478 303,445 33.015. Pinrang 2.9 48.1 28.8 0.515 260,494 382,662 38.116. Enrekang 8.0 50.0 35.4 0.507 373,463 379,097 55.317. Luwu 2.9 48.7 31.5 0.496 412,346 593,099 42.218. Tana Toraja 5.0 38.4 35.9 0.480 309,879 341,248 51.319. Polewali Mamasa 10.0 51.9 38.5 0.525 232,068 303,939 54.620. Majene 4.2 49.0 32.1 0.516 338,548 412,576 45.421. Mamuju 6.7 40.7 30.0 0.483 310,617 339,333 50.171. Ujung Pandang 7.0 43.0 33.1 0.512 348,387 460,051 48.272. Pare Pare 8.0 49.0 30.6 0.514 366,701 380,100 51.574. South East Sulawesi 2.5 40.2 36.5 0.501 300,875 364,137 46.001. Buton 7.5 47.9 40.5 0.510 337,191 390,524 54.902. Muna 10.0 33.2 43.1 0.501 262,778 360,971 53.203. Kendari 4.4 30.6 36.9 0.492 244,530 279,914 46.404. Kolaka 6.7 40.6 26.0 0.496 347,249 382,125 45.071. Kendari 16.0 44.7 31.8 0.508 292,641 401,877 56.381. Maluku 7.5 55.3 35.0 0.500 332,968 394,393 52.701. South East Maluku 3.1 63.0 36.1 0.505 243,695 388,620 41.602. Central Maluku 2.2 62.3 34.9 0.502 311,298 317,012 46.803. North Maluku 8.9 50.6 34.1 0.495 343,188 475,257 52.104. Central Halmahera 0.0 37.5 33.0 0.488 304,789 348,088 42.171. Ambon 8.6 52.9 38.0 0.508 381,112 400,068 57.4130 National <strong>Human</strong> <strong>Development</strong> <strong>Report</strong> 2004
ProvinceKabupaten/KotaDistrictParticipation PartisipasiPerempuan of women indiparliament Parlemen(%)Perempuan Females in Pekerja seniorofficial, Profesional, managerial Teknisi, andtechnical Kepemimpinan staff positions danKetatalaksanaan (%)(%)Perempuan Femalesdalam in angkatan <strong>the</strong>labour kerja force(%)Penduduk FemalePerempuan population(%)Rata-rata AverageupahNon-agricultural Pertanian wage (Rp)(thousand Rupiah)Perempuan Female Male Laki-lakiGEM IDJ82. Irian Jaya 2.7 34.2 41.4 0.484 490,128 638,212 47.701. Merauke 5.7 47.9 41.7 0.484 513,490 748,420 53.702. Jaya Wijaya 2.5 20.1 49.8 0.489 478,213 512,618 42.103. Jaya Pura 12.0 36.7 30.6 0.490 462,684 572,099 53.304. Paniai 7.4 47.7 47.4 0.475 581,135 604,515 50.005. Fak Fak 0.0 29.1 27.7 0.475 531,287 932,575 28.206. Sorong 3.3 25.6 35.8 0.486 471,043 689,619 39.607. Manokwari 8.0 24.3 38.1 0.470 287,333 523,810 43.808. Yapen Waropen 0.0 25.8 34.7 0.489 447,344 546,383 36.509. Biak Numfor 4.0 29.8 34.1 0.493 411,038 513,152 43.671. Jaya Pura 3.3 42.0 26.6 0.486 539,078 616,222 43.6Note:1. The number before each province or district is <strong>the</strong> official area code. District refers to both regency (kabupaten) and city (kota). Where twodistricts have <strong>the</strong> same name, <strong>the</strong> one with a code number above 70 is a city.Source: BPS special tabulationNational <strong>Human</strong> <strong>Development</strong> <strong>Report</strong> 2004131
- Page 2 and 3:
NationalHuman DevelopmentReport 200
- Page 4 and 5:
ForewordIndonesia has made critical
- Page 6 and 7:
AcknowledgementsThis Report is a re
- Page 8:
AbbreviationsAPBDAPBNASEANBAPPENASB
- Page 11 and 12:
TABLES2.1 - Comparison of per capit
- Page 13 and 14:
EXECUTIVE SUMMARYIndonesiaNational
- Page 15 and 16:
to meet the Millennium Development
- Page 17 and 18:
Chapter 1Indonesia in transition:To
- Page 19 and 20:
The place of human development in I
- Page 21 and 22:
Chapter 2The state of human develop
- Page 23 and 24:
Figure 2.4 - Map of human developme
- Page 25 and 26:
Figure 2.4 - Social indicators, 197
- Page 27 and 28:
of income and corporate taxes has r
- Page 29 and 30:
Figure 2.10 - GDP growth, 1990-2003
- Page 31 and 32:
Table 2.4 - Proportion of total bri
- Page 33 and 34:
In addition, the overall sense of p
- Page 35 and 36:
themselves. On this basis Indonesia
- Page 37 and 38:
Box 3.2 - Pathways to human develop
- Page 39 and 40:
Table 3.3 - Infant mortality rate a
- Page 41 and 42:
poor is a clear recognition that de
- Page 43 and 44:
educing the infant mortality rate m
- Page 45 and 46:
assuming that 1.3 trillion would co
- Page 47 and 48:
The national figure would certainly
- Page 49 and 50:
expenditure. In practice, it would
- Page 51 and 52:
Table 4.2 - Provincial breakdown of
- Page 53 and 54:
administration, plus an allowance f
- Page 55 and 56:
Figure 4.5 - Ratio of salaries of p
- Page 57 and 58:
Appendix to Chapter 4Health and edu
- Page 59 and 60:
The third is the ‘Special Fund’
- Page 61 and 62:
Chapter 5Rethinking fiscal prioriti
- Page 63 and 64:
At the very outset, however, it sho
- Page 65 and 66:
enforcement particularly for person
- Page 67 and 68:
Another risk from decentralization
- Page 69 and 70:
Box 5.2 - Variations in poverty con
- Page 71 and 72:
physical security - which contribut
- Page 73 and 74:
centre, for example, played a signi
- Page 75 and 76:
BibliographyAbidin, A. (2002), 1 st
- Page 77 and 78:
LPEM-FEUI (2004), Draft Final Repor
- Page 79 and 80:
Subbarao, K., A. Bonnerjee, J. Brai
- Page 81 and 82:
HUMAN DEVELOPMENT INDICATORS AND IN
- Page 83 and 84:
The human development approach brin
- Page 85 and 86:
Box 2HDI, HPI-1, GDI and GEMHuman D
- Page 87 and 88:
What do the human developmentindice
- Page 89 and 90:
Table 1 - Districts making the grea
- Page 91 and 92: Table 2 - Districts with the highes
- Page 93 and 94: Figure 8 - GDI by province, 1999-20
- Page 95 and 96: Figure 12 - HPI by components, 1999
- Page 97 and 98: Technical workshopon human developm
- Page 99 and 100: • The percentage of households wi
- Page 101 and 102: 11 Percentage of people with self-t
- Page 103 and 104: Annex 2N a m esGROUP IIChairperson:
- Page 105 and 106: Changes in names due to the formati
- Page 107 and 108: LampungKab. Lampung Selatan (South
- Page 109 and 110: 1Human Development Index (HDI)by pr
- Page 111 and 112: 3Gender-related Development Index (
- Page 113 and 114: 5Human Poverty Index (HPI)by provin
- Page 115 and 116: ProvinceDistrictLiveexpectancy(year
- Page 117 and 118: ProvinceDistrictLiveexpectancy(year
- Page 119 and 120: ProvinceDistrictLiveexpectancy(year
- Page 121 and 122: ProvinceDistrictLiveexpectancy(year
- Page 123 and 124: ProvinceDistrictLife expectancy(yea
- Page 125 and 126: ProvinceDistrictLife expectancy(yea
- Page 127 and 128: ProvinceDistrictLife expectancy(yea
- Page 129 and 130: 8Gender Development Index (GDI)by d
- Page 131 and 132: ProvinceDistrictProportionof popula
- Page 133 and 134: ProvinceDistrictProportionof popula
- Page 135 and 136: ProvinceDistrictProportionof popula
- Page 137 and 138: 9Gender Empowerment Measure (GEM)by
- Page 139 and 140: ProvinceDistrictParticipationof wom
- Page 141: ProvinceKabupaten/KotaDistrictParti
- Page 145 and 146: ProvinceDistrictParticipationof wom
- Page 147 and 148: ProvinceDistrictParticipationof wom
- Page 149 and 150: ProvinceDistrictParticipationof wom
- Page 151 and 152: ProvinceDistrictParticipationof wom
- Page 153 and 154: ProvinceDistrictPeople notexpected
- Page 155 and 156: ProvinceDistrictPeople notexpected
- Page 157 and 158: ProvinceDistrictPeople notexpected
- Page 159 and 160: ProvinceDistrictPeople notexpected
- Page 161 and 162: ProvinceDistrictInfantmortalityrate
- Page 163 and 164: ProvinceDistrictInfantmortalityrate
- Page 165 and 166: ProvinceDistrictInfantmortalityrate
- Page 167 and 168: ProvinceDistrictInfantmortalityrate
- Page 169 and 170: ProvinceDistrictSchool Participatio
- Page 171 and 172: ProvinceDistrictSchool Participatio
- Page 173 and 174: ProvinceDistrictSchool Participatio
- Page 175 and 176: ProvinceDistrictSchool Participatio
- Page 177 and 178: ProvinceDistrictHouseholds withacce
- Page 179 and 180: ProvinceDistrictHouseholds withacce
- Page 181 and 182: ProvinceDistrictHouseholds withacce
- Page 183 and 184: ProvinceDistrictHouseholds withacce
- Page 185 and 186: ProvinceDistrictReal per capita GRD
- Page 187 and 188: ProvinceDistrictReal per capita GRD
- Page 189 and 190: ProvinceDistrictReal per capita GRD
- Page 191 and 192: ProvinceDistrictReal per capita GRD
- Page 193 and 194:
ProvinceDistrictLabourforceparticip
- Page 195 and 196:
ProvinceDistrictLabourforceparticip
- Page 197 and 198:
ProvinceDistrictLabourforceparticip
- Page 199 and 200:
ProvinceDistrictLabourforceparticip
- Page 201 and 202:
ProvinceDistrictDevelopmentexpendit
- Page 203 and 204:
ProvinceDistrictDevelopmentexpendit
- Page 205 and 206:
ProvinceDistrictDevelopmentexpendit
- Page 207 and 208:
ProvinceDistrictDevelopmentexpendit
- Page 209 and 210:
Computing the indicesThe Human Deve
- Page 211 and 212:
Calculating the HDIThis illustratio
- Page 213 and 214:
Calculating the GDIAs an example, t
- Page 215 and 216:
Definitions of Statistical TermsAcc
- Page 217:
School drop-out rate: the proportio