4(%3)3 - Ecole nationale supérieure de chimie de Montpellier
4(%3)3 - Ecole nationale supérieure de chimie de Montpellier
4(%3)3 - Ecole nationale supérieure de chimie de Montpellier

You also want an ePaper? Increase the reach of your titles
YUMPU automatically turns print PDFs into web optimized ePapers that Google loves.
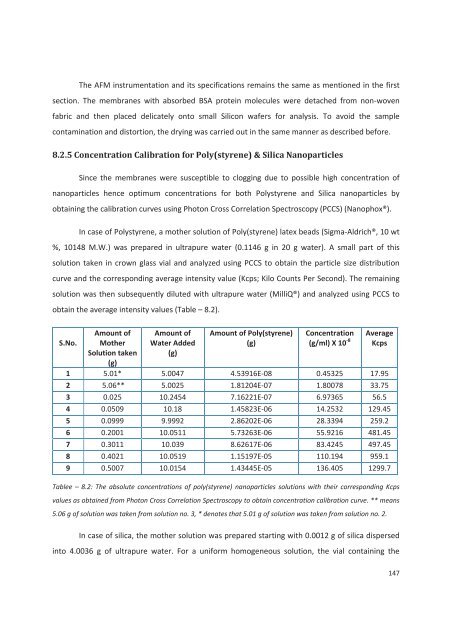
The AFM instrumentation and its specifications remains the same as mentioned in the firstsection. The membranes with absorbed BSA protein molecules were <strong>de</strong>tached from non-wovenfabric and then placed <strong>de</strong>licately onto small Silicon wafers for analysis. To avoid the samplecontamination and distortion, the drying was carried out in the same manner as <strong>de</strong>scribed before.8.2.5 Concentration Calibration for Poly(styrene) & Silica NanoparticlesSince the membranes were susceptible to clogging due to possible high concentration ofnanoparticles hence optimum concentrations for both Polystyrene and Silica nanoparticles byobtaining the calibration curves using Photon Cross Correlation Spectroscopy (PCCS) (Nanophox®).In case of Polystyrene, a mother solution of Poly(styrene) latex beads (Sigma-Aldrich®, 10 wt%, 10148 M.W.) was prepared in ultrapure water (0.1146 g in 20 g water). A small part of thissolution taken in crown glass vial and analyzed using PCCS to obtain the particle size distributioncurve and the corresponding average intensity value (Kcps; Kilo Counts Per Second). The remainingsolution was then subsequently diluted with ultrapure water (MilliQ®) and analyzed using PCCS toobtain the average intensity values (Table – 8.2).S.No.Amount ofMotherSolution taken(g)Amount ofWater Ad<strong>de</strong>d(g)Amount of Poly(styrene)(g)Concentration(g/ml) X 10 -8AverageKcps1 5.01* 5.0047 4.53916E-08 0.45325 17.952 5.06** 5.0025 1.81204E-07 1.80078 33.753 0.025 10.2454 7.16221E-07 6.97365 56.54 0.0509 10.18 1.45823E-06 14.2532 129.455 0.0999 9.9992 2.86202E-06 28.3394 259.26 0.2001 10.0511 5.73263E-06 55.9216 481.457 0.3011 10.039 8.62617E-06 83.4245 497.458 0.4021 10.0519 1.15197E-05 110.194 959.19 0.5007 10.0154 1.43445E-05 136.405 1299.7Tablee – 8.2: The absolute concentrations of poly(styrene) nanoparticles solutions with their corresponding Kcpsvalues as obtained from Photon Cross Correlation Spectroscopy to obtain concentration calibration curve. ** means5.06 g of solution was taken from solution no. 3, * <strong>de</strong>notes that 5.01 g of solution was taken from solution no. 2.In case of silica, the mother solution was prepared starting with 0.0012 g of silica dispersedinto 4.0036 g of ultrapure water. For a uniform homogeneous solution, the vial containing the147