4(%3)3 - Ecole nationale supérieure de chimie de Montpellier
4(%3)3 - Ecole nationale supérieure de chimie de Montpellier
4(%3)3 - Ecole nationale supérieure de chimie de Montpellier

Create successful ePaper yourself
Turn your PDF publications into a flip-book with our unique Google optimized e-Paper software.
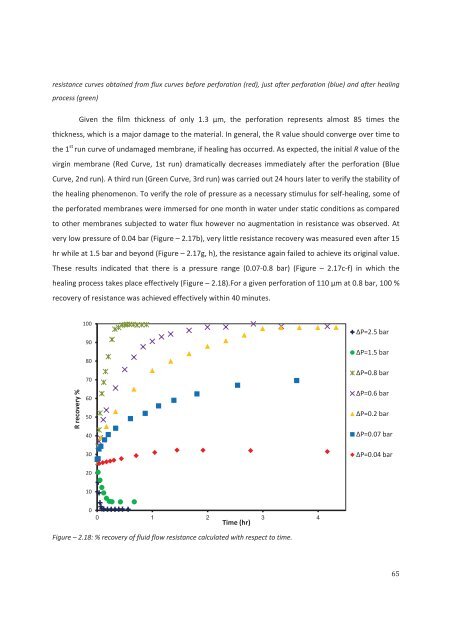
esistance curves obtained from flux curves before perforation (red), just after perforation (blue) and after healingprocess (green) thickness, which is a major damage to the material. In general, the R value should converge over time tothe 1 st run curve of undamaged membrane, if healing has occurred. As expected, the initial R value of thevirgin membrane (Red Curve, 1st run) dramatically <strong>de</strong>creases immediately after the perforation (BlueCurve, 2nd run). A third run (Green Curve, 3rd run) was carried out 24 hours later to verify the stability ofthe healing phenomenon. To verify the role of pressure as a necessary stimulus for self-healing, some ofthe perforated membranes were immersed for one month in water un<strong>de</strong>r static conditions as comparedto other membranes subjected to water flux however no augmentation in resistance was observed. Atvery low pressure of 0.04 bar (Figure – 2.17b), very little resistance recovery was measured even after 15hr while at 1.5 bar and beyond (Figure – 2.17g, h), the resistance again failed to achieve its original value.These results indicated that there is a pressure range (0.07-0.8 bar) (Figure – 2.17c-f) in which thehealing process takes place effectively (Figure – 2.18).For a given perforation of 110 µm at 0.8 bar, 100 %recovery of resistance was achieved effectively within 40 minutes.R recovery %100908070605040P=2.5 barP=1.5 barP=0.8 barP=0.6 barP=0.2 barP=0.07 bar30P=0.04 bar201000 1 2 3 4Time (hr)Figure – 2.18: % recovery of fluid flow resistance calculated with respect to time.65