- Page 1:
THESISPRESENTED ATNATIONAL GRADUATE
- Page 4 and 5:
As the human civilization progress
- Page 6 and 7:
CHAPTER - 1 SELF-HEALING POLYMERIC
- Page 8:
8.1.5 Atomic Force Microscopy …
- Page 11 and 12:
Synthetic engineering materials in
- Page 13 and 14:
esponse to a specific external stim
- Page 15 and 16:
The first work based on this approa
- Page 17 and 18:
een prepared from urea-formaldehyde
- Page 19 and 20:
monomer systems. The addition of EN
- Page 21 and 22:
Figure - 1.10: Self-healing process
- Page 23 and 24:
was required to reach healing effic
- Page 25 and 26:
In addition to above works, some ot
- Page 27 and 28:
that have been identified to be tak
- Page 29 and 30:
part of the chapter, these material
- Page 31 and 32:
Figure - 1.17: Self-healing of the
- Page 33 and 34:
commercialized under tradenames; Nu
- Page 35 and 36:
joined together at temperature high
- Page 37 and 38:
Inspired by these findings, the fir
- Page 39 and 40:
temperature greater than 80 o C in
- Page 41 and 42: Figure - 1.27: Sulfur chemistry bas
- Page 43 and 44: A different kind of sulfur chemistr
- Page 45 and 46: Figure - 1.29: Dynamic covalent che
- Page 47 and 48: cracks. The recovered droplets afte
- Page 49 and 50: 23 White, S. R. et al. Autonomic he
- Page 51 and 52: 65 Taber, D. F. & Frankowski, K. J.
- Page 53 and 54: 107 Kushner, A. M., Vossler, J. D.,
- Page 55: 148 Park, J. S., Kim, H. S. & Hahn,
- Page 58 and 59: The value of subscripts “n”,
- Page 60 and 61: The formation of spherical micelles
- Page 62 and 63: the micelle assembly showed the pre
- Page 64 and 65: gain onto the electrodes by buildin
- Page 66 and 67: The resistance R can be further exp
- Page 68 and 69: empty-tower velocity U only depends
- Page 70 and 71: This apparent morphological switchi
- Page 72 and 73: In a further qualitative analysis,
- Page 74 and 75: noteworthy and though its feasibili
- Page 76 and 77: Furthermore within this range, lowe
- Page 78 and 79: Figure - 2.22: Scanning Electron Mi
- Page 80 and 81: While the resistance measurements g
- Page 82 and 83: In conclusion, a self-healing membr
- Page 84 and 85: 23 Giacomelli, F. C., Riegel, I. C.
- Page 86 and 87: micelles enabled the membrane to se
- Page 88 and 89: The second class is represented by
- Page 90 and 91: To avoid the probable clogging of t
- Page 94 and 95: 1000900800y = 3E+06xR² = 0,9911y =
- Page 96 and 97: very high value of 1.5 g.l -1 . Thi
- Page 98 and 99: Since the only change in the membra
- Page 100 and 101: 100Retention (%)8060400,100,20,40,6
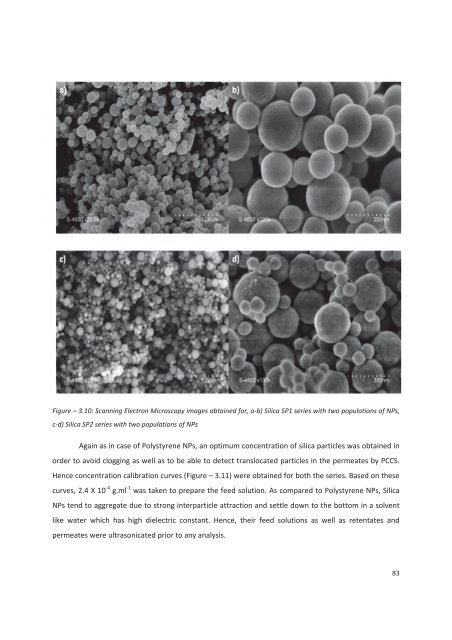
- Page 102 and 103: Figure - 3.18: Scanning Electron Mi
- Page 104 and 105: (Figure - 3.20). A cursory look at
- Page 106 and 107: When compared to poly(styrene) NPs,
- Page 108 and 109: Figure - 3.24: Scanning Electron Mi
- Page 110 and 111: REFERENCES1 Metzler, R. & Klafter,
- Page 112 and 113: 46 Bemporad, D., Luttmann, C. & Ess
- Page 114 and 115: In this chapter, preparation of 3D
- Page 116 and 117: obtain complex macromolecular archi
- Page 118 and 119: The polymerization was conducted at
- Page 120 and 121: proceeds, lesser monomer is availab
- Page 122 and 123: mg/ml),the micelles’ hydrodynamic
- Page 124 and 125: Figure - 4.15: The monolayer and mu
- Page 126 and 127: monolayer of micelles and topmost l
- Page 128 and 129: The presence of the dispersed micel
- Page 130 and 131: Heating the multilayer micelle asse
- Page 132 and 133: stable zipping of the micelles. Mul
- Page 134 and 135: 24 Moad, G., Rizzardo, E. & Thang,
- Page 136 and 137: The concept of nano-gel based self-
- Page 138 and 139: Figure - 5.4: Size distribution of
- Page 140 and 141: In a typical process, the two compo
- Page 142 and 143:
Figure - 5.10: 1HNMR spectra obtain
- Page 144 and 145:
The 1 HNMR spectrum obtained for th
- Page 146 and 147:
REFERENCES1 White, S. R. et al. Aut
- Page 148 and 149:
healing ability shown by the membra
- Page 150 and 151:
7. PERSPECTIVESBeing the first such
- Page 153 and 154:
8. MATERIALS & METHODSThis chapter
- Page 155 and 156:
8.1.3 PEG Filtration MeasurementsTh
- Page 157 and 158:
addition of TEOS due to formation o
- Page 159 and 160:
solution was ultrasonicated for 15
- Page 161 and 162:
Triethylamine (TEA) (Sigma-Aldrich
- Page 163 and 164:
To prepare the monolayer assembly o
- Page 165 and 166:
was added followed by addition of 0
- Page 168 and 169:
ELABORATION OF SELF-HEALING POLYMER
- Page 170 and 171:
ELABORATION DES MEMBRANES POLYMERES