Economic Impacts of Parks, Rivers, Trails and Greenways
Economic Impacts of Parks, Rivers, Trails and Greenways
Economic Impacts of Parks, Rivers, Trails and Greenways

Create successful ePaper yourself
Turn your PDF publications into a flip-book with our unique Google optimized e-Paper software.
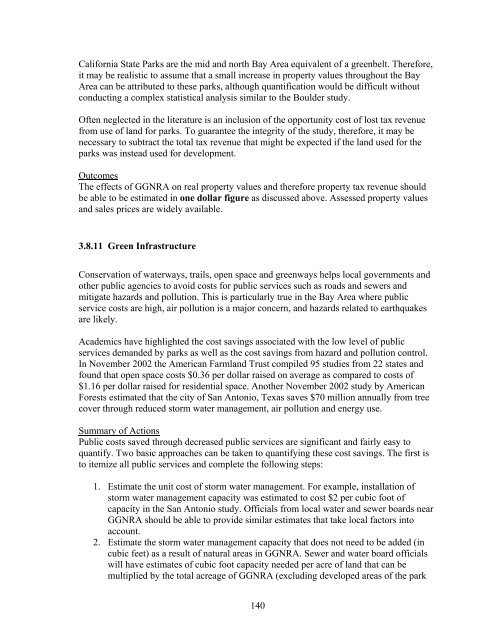
California State <strong>Parks</strong> are the mid <strong>and</strong> north Bay Area equivalent <strong>of</strong> a greenbelt. Therefore,it may be realistic to assume that a small increase in property values throughout the BayArea can be attributed to these parks, although quantification would be difficult withoutconducting a complex statistical analysis similar to the Boulder study.Often neglected in the literature is an inclusion <strong>of</strong> the opportunity cost <strong>of</strong> lost tax revenuefrom use <strong>of</strong> l<strong>and</strong> for parks. To guarantee the integrity <strong>of</strong> the study, therefore, it may benecessary to subtract the total tax revenue that might be expected if the l<strong>and</strong> used for theparks was instead used for development.OutcomesThe effects <strong>of</strong> GGNRA on real property values <strong>and</strong> therefore property tax revenue shouldbe able to be estimated in one dollar figure as discussed above. Assessed property values<strong>and</strong> sales prices are widely available.3.8.11 Green InfrastructureConservation <strong>of</strong> waterways, trails, open space <strong>and</strong> greenways helps local governments <strong>and</strong>other public agencies to avoid costs for public services such as roads <strong>and</strong> sewers <strong>and</strong>mitigate hazards <strong>and</strong> pollution. This is particularly true in the Bay Area where publicservice costs are high, air pollution is a major concern, <strong>and</strong> hazards related to earthquakesare likely.Academics have highlighted the cost savings associated with the low level <strong>of</strong> publicservices dem<strong>and</strong>ed by parks as well as the cost savings from hazard <strong>and</strong> pollution control.In November 2002 the American Farml<strong>and</strong> Trust compiled 95 studies from 22 states <strong>and</strong>found that open space costs $0.36 per dollar raised on average as compared to costs <strong>of</strong>$1.16 per dollar raised for residential space. Another November 2002 study by AmericanForests estimated that the city <strong>of</strong> San Antonio, Texas saves $70 million annually from treecover through reduced storm water management, air pollution <strong>and</strong> energy use.Summary <strong>of</strong> ActionsPublic costs saved through decreased public services are significant <strong>and</strong> fairly easy toquantify. Two basic approaches can be taken to quantifying these cost savings. The first isto itemize all public services <strong>and</strong> complete the following steps:1. Estimate the unit cost <strong>of</strong> storm water management. For example, installation <strong>of</strong>storm water management capacity was estimated to cost $2 per cubic foot <strong>of</strong>capacity in the San Antonio study. Officials from local water <strong>and</strong> sewer boards nearGGNRA should be able to provide similar estimates that take local factors intoaccount.2. Estimate the storm water management capacity that does not need to be added (incubic feet) as a result <strong>of</strong> natural areas in GGNRA. Sewer <strong>and</strong> water board <strong>of</strong>ficialswill have estimates <strong>of</strong> cubic foot capacity needed per acre <strong>of</strong> l<strong>and</strong> that can bemultiplied by the total acreage <strong>of</strong> GGNRA (excluding developed areas <strong>of</strong> the park140