powered activities 3 , a participant level up 8% from 1998, with an average participationfrequency <strong>of</strong> 54 times in the past 2 years. In fact, the growth <strong>of</strong> the participant base hasoutpaced natural population growth by a wide margin (OIA, 2004). Human poweredactivities with wide appeal, easy accessibility, affordability, familiarity <strong>and</strong> minimalphysical dem<strong>and</strong>s drew the largest numbers <strong>of</strong> Americans. For example, 30% <strong>of</strong> thepopulation bicycle mainly on paved roads an average <strong>of</strong> 52.3 times in the past 2 years,27% <strong>of</strong> American hiked an average <strong>of</strong> 21.5 times in the past 2 years, <strong>and</strong> 25% campednearly 6 times in the past 2 years (OIF, 2004). Participation in recreation activities varies by region, income <strong>and</strong> race, but outdoorrecreation is a widespread phenomenon. Nearly nine out <strong>of</strong> ten Americans (87%)participated in an outdoor recreational activity within the past twelve months <strong>and</strong> infact, they participated in a mean <strong>of</strong> 5.4 different activities out <strong>of</strong> the 37 outdoorrecreation activities tracked in the study (Roper, 2004). One study showed that in the past two years, participants spent an average <strong>of</strong> $787 foroutdoor activities -- $301 on apparel <strong>and</strong> $487 on equipment. People spent differentamounts at various types <strong>of</strong> retail stores. Average spending at outdoor specialty storeswas $1,485, compared to $1,079 at outdoor chain stores/sporting good stores, $848 atdiscount stores, <strong>and</strong> $1,656 online (OIF, 2004).Table 8. Average Amount Spent in the Past 2 Years by Participants (OIF, 2004)Backpacking/Hiking Apparel $342Backpacking/Hiking Equipment $596Bicycling (Paved Road) Apparel $326Bicycling (Paved Road) Equipment $524Bicycling (Off Road) Apparel $461Bicycling (Off Road) Equipment $862Birdwatching Apparel $366Birdwatching Equipment $667Camping Apparel $351Camping Equipment $626Climbing Apparel $570Climbing Equipment $967Cross Country/Nordic/Telemark Skiing Apparel $807Cross Country/Nordic/Telemark Skiing Equipment $1,739Fly Fishing Apparel $761Fly Fishing Equipment $1,696Paddle Sports Apparel $409Paddle Sports Equipment $780Snowboarding/Downhill Skiing Apparel $587Snowboarding/Downhill Skiing Equipment $1,004Snowshoeing Apparel $753Snowshoeing Equipment $1,432Trail Running Apparel $544Trail Running Equipment $7243 Core activities include backpacking, bicycling, bird watching, canoeing, camping, climbing, skiing, fishing,hiking, kayaking, rafting, snowshoeing, <strong>and</strong> trail running.33
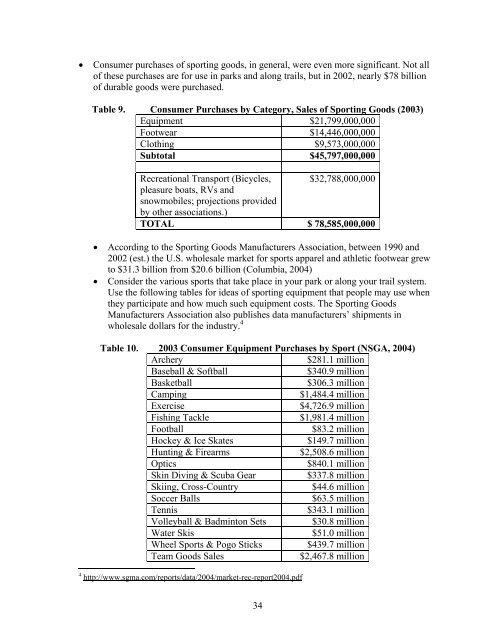
Consumer purchases <strong>of</strong> sporting goods, in general, were even more significant. Not all<strong>of</strong> these purchases are for use in parks <strong>and</strong> along trails, but in 2002, nearly $78 billion<strong>of</strong> durable goods were purchased.Table 9. Consumer Purchases by Category, Sales <strong>of</strong> Sporting Goods (2003)Equipment $21,799,000,000Footwear $14,446,000,000Clothing $9,573,000,000Subtotal $45,797,000,000Recreational Transport (Bicycles, $32,788,000,000pleasure boats, RVs <strong>and</strong>snowmobiles; projections providedby other associations.)TOTAL $ 78,585,000,000According to the Sporting Goods Manufacturers Association, between 1990 <strong>and</strong>2002 (est.) the U.S. wholesale market for sports apparel <strong>and</strong> athletic footwear grewto $31.3 billion from $20.6 billion (Columbia, 2004)Consider the various sports that take place in your park or along your trail system.Use the following tables for ideas <strong>of</strong> sporting equipment that people may use whenthey participate <strong>and</strong> how much such equipment costs. The Sporting GoodsManufacturers Association also publishes data manufacturers’ shipments inwholesale dollars for the industry. 4Table 10. 2003 Consumer Equipment Purchases by Sport (NSGA, 2004)Archery$281.1 millionBaseball & S<strong>of</strong>tball$340.9 millionBasketball$306.3 millionCamping$1,484.4 millionExercise$4,726.9 millionFishing Tackle$1,981.4 millionFootball$83.2 millionHockey & Ice Skates$149.7 millionHunting & Firearms$2,508.6 millionOptics$840.1 millionSkin Diving & Scuba Gear$337.8 millionSkiing, Cross-Country$44.6 millionSoccer Balls$63.5 millionTennis$343.1 millionVolleyball & Badminton Sets $30.8 millionWater Skis$51.0 millionWheel Sports & Pogo Sticks $439.7 millionTeam Goods Sales$2,467.8 million4 http://www.sgma.com/reports/data/2004/market-rec-report2004.pdf34
- Page 1: ECONOMIC IMPACTS OF PARKS, RIVERS,
- Page 4 and 5: AcknowledgementsI am grateful to ma
- Page 6 and 7: 3.5.5 Sources of Information.......
- Page 8 and 9: Table 28. Hiking/Walking Organizati
- Page 10 and 11: 1 IntroductionParks, rivers, trails
- Page 12 and 13: Table 1.SectionAgency ExpendituresC
- Page 14 and 15: provide communities with economic,
- Page 16 and 17: the most current information on the
- Page 18 and 19: 3.1 Agency ExpendituresThis section
- Page 20 and 21: grants. About 25% of capital expend
- Page 22 and 23: The Marin Conservation Corps (MCC)
- Page 24 and 25: already been implemented and is ope
- Page 26 and 27: Table 5.Net Benefit Per Participant
- Page 28 and 29: WEST VIRGINIAWISCONSINEarthCorpsFed
- Page 30 and 31: contracts that gross over $800 mill
- Page 32 and 33: 3.2.2 Special EventsRevenue enhanci
- Page 34 and 35: park experience to an audience who
- Page 36 and 37: you have the opportunity to determi
- Page 38 and 39: Use good survey methods. The better
- Page 40 and 41: California. A Report to The Sierra
- Page 44 and 45: Table 11. 2003 Sport Footwear Purch
- Page 46 and 47: 3.3.4 Fish and Wildlife-Related Rec
- Page 48 and 49: EQUIPMENT AND OTHER EXPENSESTotal $
- Page 50 and 51: Table 17. Estimates of Retail Expen
- Page 52 and 53: Table 19. U.S. Ski & Snowboard Indu
- Page 54 and 55: and from services related to the Pa
- Page 56 and 57: o $60 million in Harris County, TX,
- Page 58 and 59: League ofAmericanBicyclistsNational
- Page 60 and 61: SportingGoodsManufacturersAssociati
- Page 62 and 63: necessarily better, especially in s
- Page 64 and 65: Perspective. Available at http://ww
- Page 66 and 67: o Washington: $209 milliono West Vi
- Page 68 and 69: Economic Output Retail Sales Salari
- Page 70 and 71: Economic Output Retail Sales Salari
- Page 72 and 73: Table 35. Economic Impact of Sportf
- Page 74 and 75: All Anglers Non-Resident/Tourist An
- Page 76 and 77: Table 37. Per Capita Travel Receipt
- Page 78 and 79: their decision to return in the fut
- Page 80 and 81: Table 39. Visitors and Spending in
- Page 82 and 83: 2003). Data from California Departm
- Page 84 and 85: over 2003, despite high gas prices,
- Page 86 and 87: management changes or actions are e
- Page 88 and 89: accommodations used, and other trip
- Page 90 and 91: http://www.ncdot.org/transit/bicycl
- Page 92 and 93:
3.5 Estimating the Effects of Spend
- Page 94 and 95:
“leakage” of money from the reg
- Page 96 and 97:
Keep in mind that multipliers are s
- Page 98 and 99:
3.5.4 How to Use These Rationales i
- Page 100 and 101:
economy, only those expenditures th
- Page 102 and 103:
For example, be aware of the differ
- Page 104 and 105:
3.6 Health Care and FitnessThis sec
- Page 106 and 107:
active, approximately $575 million
- Page 108 and 109:
already had one heart attacko Impro
- Page 110 and 111:
uilt as part of sound policy to pro
- Page 112 and 113:
accounting for 14 million disabilit
- Page 114 and 115:
park amenities available or do not
- Page 116 and 117:
National Coalitionfor PromotingPhys
- Page 118 and 119:
100% of all health benefits to a si
- Page 120 and 121:
Pratt M, Macera CA, Wang G. 2000. H
- Page 122 and 123:
costs than normal weight; moderate
- Page 124 and 125:
References for Additional Informati
- Page 126 and 127:
3.7 Benefit EstimationParks, rivers
- Page 128 and 129:
Table 47.Forecasted Average Benefit
- Page 130 and 131:
Table 48.CriteriaRecreationExperien
- Page 132 and 133:
people using carefully designed and
- Page 134 and 135:
special government funds for causes
- Page 136 and 137:
Loomis, J. B., and White, D.S. 1996
- Page 138 and 139:
Economic Assessment for the Necedah
- Page 140 and 141:
Commercial UsesExpenditures byResid
- Page 142 and 143:
Outcomes Expenditures by GGNRA mana
- Page 144 and 145:
local transportation admissions and
- Page 146 and 147:
3.8.8 Educational ValueWhile it may
- Page 148 and 149:
the same municipality that are furt
- Page 150 and 151:
that do require storm water managem
- Page 152 and 153:
Summary of ActionsSimilar to corpor
- Page 154 and 155:
3.9 Resource Book AppendicesSeveral
- Page 156 and 157:
6. Spending in the area. Please rep
- Page 158 and 159:
local economy aren’t bringing in
- Page 160 and 161:
4 ConclusionIn 1995, the National P