“leakage” <strong>of</strong> money from the region because it is no longer circulating within thecommunity. If the local businesses purchase all their input supplies from outside the area,the direct <strong>and</strong> indirect impacts on the local economy would be zero. Similarly, if employeesreside outside the community they are much less likely to spend their income at localbusinesses <strong>and</strong> induced impacts are likely to be minimal. When defining the bounds <strong>of</strong> yourlocal economy, remember that wider bounds may allow the money to circulate within itlonger, but that less new money will come into the region.3.5.2 MultipliersHow are the indirect <strong>and</strong> induced effects estimated? Economists <strong>of</strong>ten use multipliers toestimate what the size <strong>of</strong> the secondary effects relative to the direct effects. Type Imultipliers only capture indirect effects while Type II multipliers capture both indirect <strong>and</strong>induced effects. A multiplier is a ratio, which for Type II multipliers, is the total effectsdivided by the direct effect. They are usually written in decimal format, such as 1.7. Thegreater the multiplier, the greater the increase in economic activity in the local economy.There are many variations on these multipliers; some are expressed in terms <strong>of</strong> sales, jobs,income, or value added, <strong>and</strong> there are caveats associated with each.Sales by firms in the region; equated with visitor spending. Reporting economicimpact in terms <strong>of</strong> sales is extremely common because it <strong>of</strong>ten generates the highesteconomic impact number, but it doesn’t necessarily reflect how residents areaffected. Thus, it may be a less meaningful indicator for elected <strong>of</strong>ficials <strong>and</strong>decision-makers.Jobs, while <strong>of</strong>ten reported consistently as the number <strong>of</strong> people employed by firms<strong>and</strong> businesses in the local region, may not differentiate between part-time <strong>and</strong> fulltimejobs <strong>and</strong> therefore can be misleading. Thus, employment estimates may not thebest way to compare impacts across sectors or regions because they doesn’t reflectseasonality or variation in wage rates. For special events in particular, the managingagencies or local businesses may not hire new full-time employees because <strong>of</strong> theshort duration <strong>of</strong> the event; instead existing employees may simply work longerhours. Even if new jobs are created, there is no guarantee they will be filled byresidents from within your economic boundary. Finally, using employmentmultipliers assumes that that all current employees in a community are completelyoccupied so when visitor spending increases, there will need to be increased levels<strong>of</strong> employment. This may not be the case, but all jurisdictions face the samelimitations when performing their analyses.Income may have different ways <strong>of</strong> measurement. For example, payroll incomeincludes wages <strong>and</strong> salaries, payroll benefits <strong>and</strong> income <strong>of</strong> sole proprietors, whiletotal income also includes pr<strong>of</strong>its <strong>and</strong> rents <strong>of</strong> businesses. Personal or total income is<strong>of</strong>ten reported because it is straightforward to underst<strong>and</strong>.Value added is most <strong>of</strong>ten preferred by economists because it captures thecontribution <strong>of</strong> the activity or industry to gross regional or national product. Itincludes personal income to households, pr<strong>of</strong>its <strong>of</strong> private firms <strong>and</strong> indirectbusiness taxes accruing to government units in the region. However, value added is85
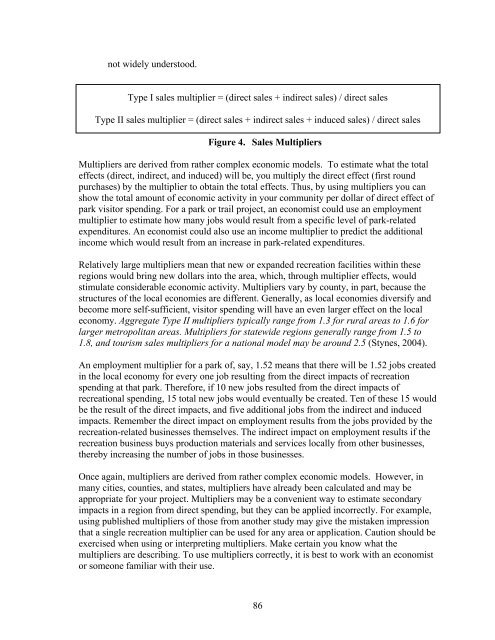
not widely understood.Type I sales multiplier = (direct sales + indirect sales) / direct salesType II sales multiplier = (direct sales + indirect sales + induced sales) / direct salesFigure 4. Sales MultipliersMultipliers are derived from rather complex economic models. To estimate what the totaleffects (direct, indirect, <strong>and</strong> induced) will be, you multiply the direct effect (first roundpurchases) by the multiplier to obtain the total effects. Thus, by using multipliers you canshow the total amount <strong>of</strong> economic activity in your community per dollar <strong>of</strong> direct effect <strong>of</strong>park visitor spending. For a park or trail project, an economist could use an employmentmultiplier to estimate how many jobs would result from a specific level <strong>of</strong> park-relatedexpenditures. An economist could also use an income multiplier to predict the additionalincome which would result from an increase in park-related expenditures.Relatively large multipliers mean that new or exp<strong>and</strong>ed recreation facilities within theseregions would bring new dollars into the area, which, through multiplier effects, wouldstimulate considerable economic activity. Multipliers vary by county, in part, because thestructures <strong>of</strong> the local economies are different. Generally, as local economies diversify <strong>and</strong>become more self-sufficient, visitor spending will have an even larger effect on the localeconomy. Aggregate Type II multipliers typically range from 1.3 for rural areas to 1.6 forlarger metropolitan areas. Multipliers for statewide regions generally range from 1.5 to1.8, <strong>and</strong> tourism sales multipliers for a national model may be around 2.5 (Stynes, 2004).An employment multiplier for a park <strong>of</strong>, say, 1.52 means that there will be 1.52 jobs createdin the local economy for every one job resulting from the direct impacts <strong>of</strong> recreationspending at that park. Therefore, if 10 new jobs resulted from the direct impacts <strong>of</strong>recreational spending, 15 total new jobs would eventually be created. Ten <strong>of</strong> these 15 wouldbe the result <strong>of</strong> the direct impacts, <strong>and</strong> five additional jobs from the indirect <strong>and</strong> inducedimpacts. Remember the direct impact on employment results from the jobs provided by therecreation-related businesses themselves. The indirect impact on employment results if therecreation business buys production materials <strong>and</strong> services locally from other businesses,thereby increasing the number <strong>of</strong> jobs in those businesses.Once again, multipliers are derived from rather complex economic models. However, inmany cities, counties, <strong>and</strong> states, multipliers have already been calculated <strong>and</strong> may beappropriate for your project. Multipliers may be a convenient way to estimate secondaryimpacts in a region from direct spending, but they can be applied incorrectly. For example,using published multipliers <strong>of</strong> those from another study may give the mistaken impressionthat a single recreation multiplier can be used for any area or application. Caution should beexercised when using or interpreting multipliers. Make certain you know what themultipliers are describing. To use multipliers correctly, it is best to work with an economistor someone familiar with their use.86
- Page 1:
ECONOMIC IMPACTS OF PARKS, RIVERS,
- Page 4 and 5:
AcknowledgementsI am grateful to ma
- Page 6 and 7:
3.5.5 Sources of Information.......
- Page 8 and 9:
Table 28. Hiking/Walking Organizati
- Page 10 and 11:
1 IntroductionParks, rivers, trails
- Page 12 and 13:
Table 1.SectionAgency ExpendituresC
- Page 14 and 15:
provide communities with economic,
- Page 16 and 17:
the most current information on the
- Page 18 and 19:
3.1 Agency ExpendituresThis section
- Page 20 and 21:
grants. About 25% of capital expend
- Page 22 and 23:
The Marin Conservation Corps (MCC)
- Page 24 and 25:
already been implemented and is ope
- Page 26 and 27:
Table 5.Net Benefit Per Participant
- Page 28 and 29:
WEST VIRGINIAWISCONSINEarthCorpsFed
- Page 30 and 31:
contracts that gross over $800 mill
- Page 32 and 33:
3.2.2 Special EventsRevenue enhanci
- Page 34 and 35:
park experience to an audience who
- Page 36 and 37:
you have the opportunity to determi
- Page 38 and 39:
Use good survey methods. The better
- Page 40 and 41:
California. A Report to The Sierra
- Page 42 and 43:
powered activities 3 , a participan
- Page 44 and 45: Table 11. 2003 Sport Footwear Purch
- Page 46 and 47: 3.3.4 Fish and Wildlife-Related Rec
- Page 48 and 49: EQUIPMENT AND OTHER EXPENSESTotal $
- Page 50 and 51: Table 17. Estimates of Retail Expen
- Page 52 and 53: Table 19. U.S. Ski & Snowboard Indu
- Page 54 and 55: and from services related to the Pa
- Page 56 and 57: o $60 million in Harris County, TX,
- Page 58 and 59: League ofAmericanBicyclistsNational
- Page 60 and 61: SportingGoodsManufacturersAssociati
- Page 62 and 63: necessarily better, especially in s
- Page 64 and 65: Perspective. Available at http://ww
- Page 66 and 67: o Washington: $209 milliono West Vi
- Page 68 and 69: Economic Output Retail Sales Salari
- Page 70 and 71: Economic Output Retail Sales Salari
- Page 72 and 73: Table 35. Economic Impact of Sportf
- Page 74 and 75: All Anglers Non-Resident/Tourist An
- Page 76 and 77: Table 37. Per Capita Travel Receipt
- Page 78 and 79: their decision to return in the fut
- Page 80 and 81: Table 39. Visitors and Spending in
- Page 82 and 83: 2003). Data from California Departm
- Page 84 and 85: over 2003, despite high gas prices,
- Page 86 and 87: management changes or actions are e
- Page 88 and 89: accommodations used, and other trip
- Page 90 and 91: http://www.ncdot.org/transit/bicycl
- Page 92 and 93: 3.5 Estimating the Effects of Spend
- Page 96 and 97: Keep in mind that multipliers are s
- Page 98 and 99: 3.5.4 How to Use These Rationales i
- Page 100 and 101: economy, only those expenditures th
- Page 102 and 103: For example, be aware of the differ
- Page 104 and 105: 3.6 Health Care and FitnessThis sec
- Page 106 and 107: active, approximately $575 million
- Page 108 and 109: already had one heart attacko Impro
- Page 110 and 111: uilt as part of sound policy to pro
- Page 112 and 113: accounting for 14 million disabilit
- Page 114 and 115: park amenities available or do not
- Page 116 and 117: National Coalitionfor PromotingPhys
- Page 118 and 119: 100% of all health benefits to a si
- Page 120 and 121: Pratt M, Macera CA, Wang G. 2000. H
- Page 122 and 123: costs than normal weight; moderate
- Page 124 and 125: References for Additional Informati
- Page 126 and 127: 3.7 Benefit EstimationParks, rivers
- Page 128 and 129: Table 47.Forecasted Average Benefit
- Page 130 and 131: Table 48.CriteriaRecreationExperien
- Page 132 and 133: people using carefully designed and
- Page 134 and 135: special government funds for causes
- Page 136 and 137: Loomis, J. B., and White, D.S. 1996
- Page 138 and 139: Economic Assessment for the Necedah
- Page 140 and 141: Commercial UsesExpenditures byResid
- Page 142 and 143: Outcomes Expenditures by GGNRA mana
- Page 144 and 145:
local transportation admissions and
- Page 146 and 147:
3.8.8 Educational ValueWhile it may
- Page 148 and 149:
the same municipality that are furt
- Page 150 and 151:
that do require storm water managem
- Page 152 and 153:
Summary of ActionsSimilar to corpor
- Page 154 and 155:
3.9 Resource Book AppendicesSeveral
- Page 156 and 157:
6. Spending in the area. Please rep
- Page 158 and 159:
local economy aren’t bringing in
- Page 160 and 161:
4 ConclusionIn 1995, the National P