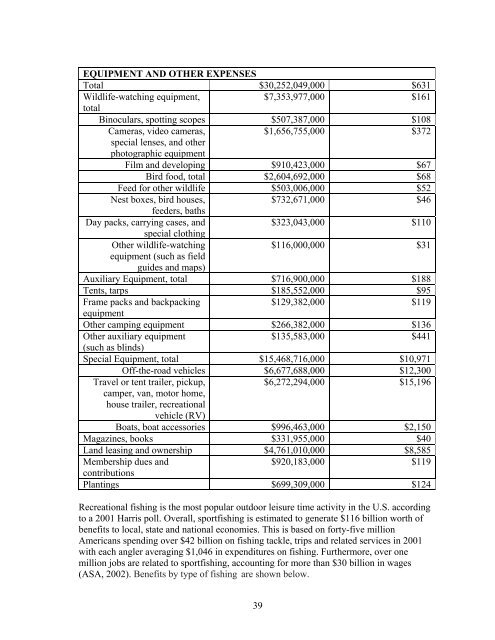
EQUIPMENT AND OTHER EXPENSESTotal $30,252,049,000 $631Wildlife-watching equipment,$7,353,977,000 $161totalBinoculars, spotting scopes $507,387,000 $108Cameras, video cameras,$1,656,755,000 $372special lenses, <strong>and</strong> otherphotographic equipmentFilm <strong>and</strong> developing $910,423,000 $67Bird food, total $2,604,692,000 $68Feed for other wildlife $503,006,000 $52Nest boxes, bird houses,$732,671,000 $46feeders, bathsDay packs, carrying cases, <strong>and</strong>$323,043,000 $110special clothingOther wildlife-watching$116,000,000 $31equipment (such as fieldguides <strong>and</strong> maps)Auxiliary Equipment, total $716,900,000 $188Tents, tarps $185,552,000 $95Frame packs <strong>and</strong> backpacking$129,382,000 $119equipmentOther camping equipment $266,382,000 $136Other auxiliary equipment$135,583,000 $441(such as blinds)Special Equipment, total $15,468,716,000 $10,971Off-the-road vehicles $6,677,688,000 $12,300Travel or tent trailer, pickup,$6,272,294,000 $15,196camper, van, motor home,house trailer, recreationalvehicle (RV)Boats, boat accessories $996,463,000 $2,150Magazines, books $331,955,000 $40L<strong>and</strong> leasing <strong>and</strong> ownership $4,761,010,000 $8,585Membership dues <strong>and</strong>$920,183,000 $119contributionsPlantings $699,309,000 $124Recreational fishing is the most popular outdoor leisure time activity in the U.S. accordingto a 2001 Harris poll. Overall, sportfishing is estimated to generate $116 billion worth <strong>of</strong>benefits to local, state <strong>and</strong> national economies. This is based on forty-five millionAmericans spending over $42 billion on fishing tackle, trips <strong>and</strong> related services in 2001with each angler averaging $1,046 in expenditures on fishing. Furthermore, over onemillion jobs are related to sportfishing, accounting for more than $30 billion in wages(ASA, 2002). Benefits by type <strong>of</strong> fishing are shown below.39
Table 15. Fishing BenefitsTotal Freshwater SaltwaterAnglers 34.1 million 28.4 million 9.1 millionExpenditures $41.5 billion $29.5 billion $11.3 billion<strong>Economic</strong> Output $116.1 billion $74.8 billion $31.1 billionJobs 1,068,046 683,892 296,898Wages & Salaries $30.1 billion $19.4 billion $8.1 billionTaxes $7.3 billion $4.8 billion $2.0 billion*Anglers aged 16 years <strong>and</strong> over. Approximately 10.3 million children aged 6 to 15 also fish, but are notincluded in the spending analysis.**Some expenditures were not classified by respondents as freshwater or saltwater. As a result, individualcategories may not add to the total.Statistics also show how fishing has a significant impact on a regional basis. In 2001, 1.4million Ohio anglers spent $944.6 million in fishing related expenditures (US FWS, 2001).3.3.5 BoatingRecreational boating is one <strong>of</strong> the nation’s most popular outdoor activities <strong>and</strong> includesrafting, rowing, kayaking, canoeing, motorboating, <strong>and</strong> jetskiing. It can take place on rivers,lakes <strong>and</strong> reservoirs, <strong>and</strong> along the nation’s ocean coastline. On a national scale, boating’simpacts are significant <strong>and</strong> continue to grow. Over 72 million Americans participated in recreational boating in 2003 <strong>and</strong> 5.5million went waterskiing. An estimated 840,800 new boats were sold for a totalretail value <strong>of</strong> $10.6 billion, with an average retail price <strong>of</strong> $12,611. Another $2.5billion was spent on new outboard motors (NNMA, 2003) The number <strong>of</strong> recreational watercraft owned in the U.S. is over 17 million,representing a 10% increase since 1988 (Ohio DNR, 2003). There were 86,700 canoes <strong>and</strong> 324,000 kayaks sold in 2003 at an average unit cost<strong>of</strong> $573 <strong>and</strong> $466, respectively. The total retail value <strong>of</strong> these two segments alonewas $200 million (NMMA, 2003). Over $30 billion is estimated to be spent nationwide on the purchase <strong>of</strong> new <strong>and</strong>used boats, motors, engines, trailers, accessories <strong>and</strong> other marine relatedexpenditures. This is nearly triples the $11.2 billion that was spent in 1993 (OhioDNR, 2003). There are 1,782 federally-operated reservoirs/lakes that support 900 millionrecreational visits per year, representing an economic value <strong>of</strong> $44 billion annually(NRLSC, 1999). Between 1987 <strong>and</strong> 2003, participation in kayaking rose by 80% (SGMA, 2004).Table 16. Retail Boating Market: 2003CanoesKayaksTotal Units Sold 86,700 324,000Retail Value $49,644,420 $151,048,800Average Unit Cost $573 $46640
- Page 1: ECONOMIC IMPACTS OF PARKS, RIVERS,
- Page 4 and 5: AcknowledgementsI am grateful to ma
- Page 6 and 7: 3.5.5 Sources of Information.......
- Page 8 and 9: Table 28. Hiking/Walking Organizati
- Page 10 and 11: 1 IntroductionParks, rivers, trails
- Page 12 and 13: Table 1.SectionAgency ExpendituresC
- Page 14 and 15: provide communities with economic,
- Page 16 and 17: the most current information on the
- Page 18 and 19: 3.1 Agency ExpendituresThis section
- Page 20 and 21: grants. About 25% of capital expend
- Page 22 and 23: The Marin Conservation Corps (MCC)
- Page 24 and 25: already been implemented and is ope
- Page 26 and 27: Table 5.Net Benefit Per Participant
- Page 28 and 29: WEST VIRGINIAWISCONSINEarthCorpsFed
- Page 30 and 31: contracts that gross over $800 mill
- Page 32 and 33: 3.2.2 Special EventsRevenue enhanci
- Page 34 and 35: park experience to an audience who
- Page 36 and 37: you have the opportunity to determi
- Page 38 and 39: Use good survey methods. The better
- Page 40 and 41: California. A Report to The Sierra
- Page 42 and 43: powered activities 3 , a participan
- Page 44 and 45: Table 11. 2003 Sport Footwear Purch
- Page 46 and 47: 3.3.4 Fish and Wildlife-Related Rec
- Page 50 and 51: Table 17. Estimates of Retail Expen
- Page 52 and 53: Table 19. U.S. Ski & Snowboard Indu
- Page 54 and 55: and from services related to the Pa
- Page 56 and 57: o $60 million in Harris County, TX,
- Page 58 and 59: League ofAmericanBicyclistsNational
- Page 60 and 61: SportingGoodsManufacturersAssociati
- Page 62 and 63: necessarily better, especially in s
- Page 64 and 65: Perspective. Available at http://ww
- Page 66 and 67: o Washington: $209 milliono West Vi
- Page 68 and 69: Economic Output Retail Sales Salari
- Page 70 and 71: Economic Output Retail Sales Salari
- Page 72 and 73: Table 35. Economic Impact of Sportf
- Page 74 and 75: All Anglers Non-Resident/Tourist An
- Page 76 and 77: Table 37. Per Capita Travel Receipt
- Page 78 and 79: their decision to return in the fut
- Page 80 and 81: Table 39. Visitors and Spending in
- Page 82 and 83: 2003). Data from California Departm
- Page 84 and 85: over 2003, despite high gas prices,
- Page 86 and 87: management changes or actions are e
- Page 88 and 89: accommodations used, and other trip
- Page 90 and 91: http://www.ncdot.org/transit/bicycl
- Page 92 and 93: 3.5 Estimating the Effects of Spend
- Page 94 and 95: “leakage” of money from the reg
- Page 96 and 97: Keep in mind that multipliers are s
- Page 98 and 99:
3.5.4 How to Use These Rationales i
- Page 100 and 101:
economy, only those expenditures th
- Page 102 and 103:
For example, be aware of the differ
- Page 104 and 105:
3.6 Health Care and FitnessThis sec
- Page 106 and 107:
active, approximately $575 million
- Page 108 and 109:
already had one heart attacko Impro
- Page 110 and 111:
uilt as part of sound policy to pro
- Page 112 and 113:
accounting for 14 million disabilit
- Page 114 and 115:
park amenities available or do not
- Page 116 and 117:
National Coalitionfor PromotingPhys
- Page 118 and 119:
100% of all health benefits to a si
- Page 120 and 121:
Pratt M, Macera CA, Wang G. 2000. H
- Page 122 and 123:
costs than normal weight; moderate
- Page 124 and 125:
References for Additional Informati
- Page 126 and 127:
3.7 Benefit EstimationParks, rivers
- Page 128 and 129:
Table 47.Forecasted Average Benefit
- Page 130 and 131:
Table 48.CriteriaRecreationExperien
- Page 132 and 133:
people using carefully designed and
- Page 134 and 135:
special government funds for causes
- Page 136 and 137:
Loomis, J. B., and White, D.S. 1996
- Page 138 and 139:
Economic Assessment for the Necedah
- Page 140 and 141:
Commercial UsesExpenditures byResid
- Page 142 and 143:
Outcomes Expenditures by GGNRA mana
- Page 144 and 145:
local transportation admissions and
- Page 146 and 147:
3.8.8 Educational ValueWhile it may
- Page 148 and 149:
the same municipality that are furt
- Page 150 and 151:
that do require storm water managem
- Page 152 and 153:
Summary of ActionsSimilar to corpor
- Page 154 and 155:
3.9 Resource Book AppendicesSeveral
- Page 156 and 157:
6. Spending in the area. Please rep
- Page 158 and 159:
local economy aren’t bringing in
- Page 160 and 161:
4 ConclusionIn 1995, the National P