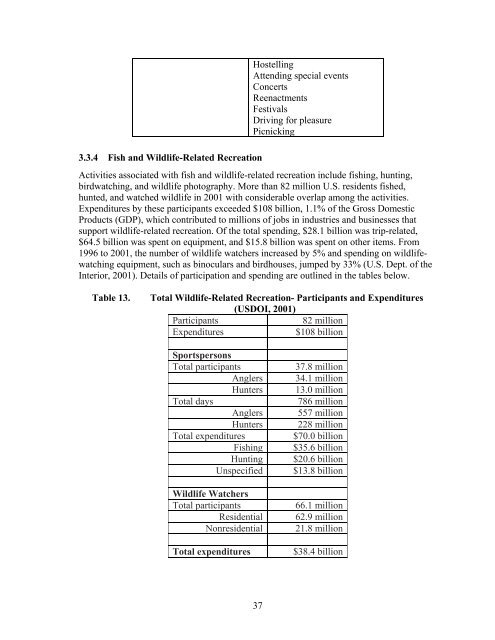
3.3.4 Fish <strong>and</strong> Wildlife-Related RecreationHostellingAttending special eventsConcertsReenactmentsFestivalsDriving for pleasurePicnickingActivities associated with fish <strong>and</strong> wildlife-related recreation include fishing, hunting,birdwatching, <strong>and</strong> wildlife photography. More than 82 million U.S. residents fished,hunted, <strong>and</strong> watched wildlife in 2001 with considerable overlap among the activities.Expenditures by these participants exceeded $108 billion, 1.1% <strong>of</strong> the Gross DomesticProducts (GDP), which contributed to millions <strong>of</strong> jobs in industries <strong>and</strong> businesses thatsupport wildlife-related recreation. Of the total spending, $28.1 billion was trip-related,$64.5 billion was spent on equipment, <strong>and</strong> $15.8 billion was spent on other items. From1996 to 2001, the number <strong>of</strong> wildlife watchers increased by 5% <strong>and</strong> spending on wildlifewatchingequipment, such as binoculars <strong>and</strong> birdhouses, jumped by 33% (U.S. Dept. <strong>of</strong> theInterior, 2001). Details <strong>of</strong> participation <strong>and</strong> spending are outlined in the tables below.Table 13.Total Wildlife-Related Recreation- Participants <strong>and</strong> Expenditures(USDOI, 2001)Participants82 millionExpenditures$108 billionSportspersonsTotal participantsAnglersHuntersTotal daysAnglersHuntersTotal expendituresFishingHuntingUnspecifiedWildlife WatchersTotal participantsResidentialNonresidentialTotal expenditures37.8 million34.1 million13.0 million786 million557 million228 million$70.0 billion$35.6 billion$20.6 billion$13.8 billion66.1 million62.9 million21.8 million$38.4 billion37
Source: U.S. Department <strong>of</strong> the Interior, 2001Figure 1. Expenditures for Wildlife-Related Recreation (2001): Totalexpenditures: $108 billionTable 14. Expenditures for Wildlife Watching: 2001Expenditure item Expenditures Average per spenderTotal, all items $38,414,488,000 $738TRIP-RELATED EXPENDITURESTotal trip-related $8,162,439,000 $448Food <strong>and</strong> lodging, total $4,818,843,000 $314Food $2,835,868,000 $186Lodging $1,982,975,000 $351Transportation, total $2,595,542,000 $152Public $702,231,000 $354Private $1,893,311,000 $115Other trip costs, total $748,054,000 $118Guide fees, pack trip or$113,034,000 $94package feesPublic l<strong>and</strong> use fees $114,813,000 $30Private l<strong>and</strong> use fees $50,430,000 $58Equipment rental $105,198,000 $91Boating costs (launching,$326,461,000 $309mooring, storage, maintenance,insurance, pumpout fees, <strong>and</strong>fuel)Heating <strong>and</strong> cooking fuel $38,118,000 $2438
- Page 1: ECONOMIC IMPACTS OF PARKS, RIVERS,
- Page 4 and 5: AcknowledgementsI am grateful to ma
- Page 6 and 7: 3.5.5 Sources of Information.......
- Page 8 and 9: Table 28. Hiking/Walking Organizati
- Page 10 and 11: 1 IntroductionParks, rivers, trails
- Page 12 and 13: Table 1.SectionAgency ExpendituresC
- Page 14 and 15: provide communities with economic,
- Page 16 and 17: the most current information on the
- Page 18 and 19: 3.1 Agency ExpendituresThis section
- Page 20 and 21: grants. About 25% of capital expend
- Page 22 and 23: The Marin Conservation Corps (MCC)
- Page 24 and 25: already been implemented and is ope
- Page 26 and 27: Table 5.Net Benefit Per Participant
- Page 28 and 29: WEST VIRGINIAWISCONSINEarthCorpsFed
- Page 30 and 31: contracts that gross over $800 mill
- Page 32 and 33: 3.2.2 Special EventsRevenue enhanci
- Page 34 and 35: park experience to an audience who
- Page 36 and 37: you have the opportunity to determi
- Page 38 and 39: Use good survey methods. The better
- Page 40 and 41: California. A Report to The Sierra
- Page 42 and 43: powered activities 3 , a participan
- Page 44 and 45: Table 11. 2003 Sport Footwear Purch
- Page 48 and 49: EQUIPMENT AND OTHER EXPENSESTotal $
- Page 50 and 51: Table 17. Estimates of Retail Expen
- Page 52 and 53: Table 19. U.S. Ski & Snowboard Indu
- Page 54 and 55: and from services related to the Pa
- Page 56 and 57: o $60 million in Harris County, TX,
- Page 58 and 59: League ofAmericanBicyclistsNational
- Page 60 and 61: SportingGoodsManufacturersAssociati
- Page 62 and 63: necessarily better, especially in s
- Page 64 and 65: Perspective. Available at http://ww
- Page 66 and 67: o Washington: $209 milliono West Vi
- Page 68 and 69: Economic Output Retail Sales Salari
- Page 70 and 71: Economic Output Retail Sales Salari
- Page 72 and 73: Table 35. Economic Impact of Sportf
- Page 74 and 75: All Anglers Non-Resident/Tourist An
- Page 76 and 77: Table 37. Per Capita Travel Receipt
- Page 78 and 79: their decision to return in the fut
- Page 80 and 81: Table 39. Visitors and Spending in
- Page 82 and 83: 2003). Data from California Departm
- Page 84 and 85: over 2003, despite high gas prices,
- Page 86 and 87: management changes or actions are e
- Page 88 and 89: accommodations used, and other trip
- Page 90 and 91: http://www.ncdot.org/transit/bicycl
- Page 92 and 93: 3.5 Estimating the Effects of Spend
- Page 94 and 95: “leakage” of money from the reg
- Page 96 and 97:
Keep in mind that multipliers are s
- Page 98 and 99:
3.5.4 How to Use These Rationales i
- Page 100 and 101:
economy, only those expenditures th
- Page 102 and 103:
For example, be aware of the differ
- Page 104 and 105:
3.6 Health Care and FitnessThis sec
- Page 106 and 107:
active, approximately $575 million
- Page 108 and 109:
already had one heart attacko Impro
- Page 110 and 111:
uilt as part of sound policy to pro
- Page 112 and 113:
accounting for 14 million disabilit
- Page 114 and 115:
park amenities available or do not
- Page 116 and 117:
National Coalitionfor PromotingPhys
- Page 118 and 119:
100% of all health benefits to a si
- Page 120 and 121:
Pratt M, Macera CA, Wang G. 2000. H
- Page 122 and 123:
costs than normal weight; moderate
- Page 124 and 125:
References for Additional Informati
- Page 126 and 127:
3.7 Benefit EstimationParks, rivers
- Page 128 and 129:
Table 47.Forecasted Average Benefit
- Page 130 and 131:
Table 48.CriteriaRecreationExperien
- Page 132 and 133:
people using carefully designed and
- Page 134 and 135:
special government funds for causes
- Page 136 and 137:
Loomis, J. B., and White, D.S. 1996
- Page 138 and 139:
Economic Assessment for the Necedah
- Page 140 and 141:
Commercial UsesExpenditures byResid
- Page 142 and 143:
Outcomes Expenditures by GGNRA mana
- Page 144 and 145:
local transportation admissions and
- Page 146 and 147:
3.8.8 Educational ValueWhile it may
- Page 148 and 149:
the same municipality that are furt
- Page 150 and 151:
that do require storm water managem
- Page 152 and 153:
Summary of ActionsSimilar to corpor
- Page 154 and 155:
3.9 Resource Book AppendicesSeveral
- Page 156 and 157:
6. Spending in the area. Please rep
- Page 158 and 159:
local economy aren’t bringing in
- Page 160 and 161:
4 ConclusionIn 1995, the National P