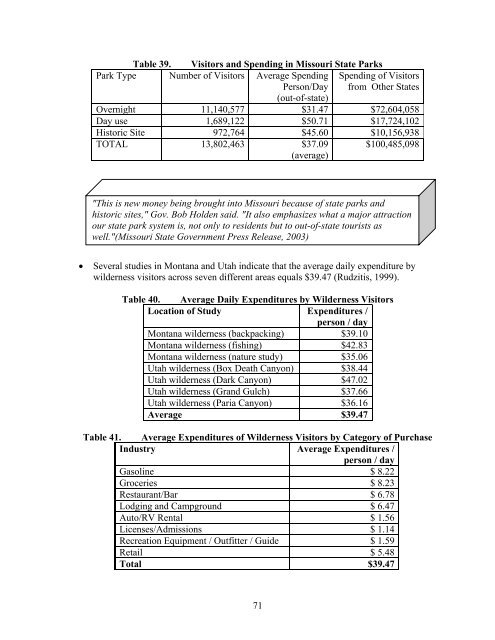
Table 39. Visitors <strong>and</strong> Spending in Missouri State <strong>Parks</strong>Park Type Number <strong>of</strong> Visitors Average SpendingPerson/DaySpending <strong>of</strong> Visitorsfrom Other States(out-<strong>of</strong>-state)Overnight 11,140,577 $31.47 $72,604,058Day use 1,689,122 $50.71 $17,724,102Historic Site 972,764 $45.60 $10,156,938TOTAL 13,802,463 $37.09(average)$100,485,098"This is new money being brought into Missouri because <strong>of</strong> state parks <strong>and</strong>historic sites," Gov. Bob Holden said. "It also emphasizes what a major attractionour state park system is, not only to residents but to out-<strong>of</strong>-state tourists aswell."(Missouri State Government Press Release, 2003)Several studies in Montana <strong>and</strong> Utah indicate that the average daily expenditure bywilderness visitors across seven different areas equals $39.47 (Rudzitis, 1999).Table 40. Average Daily Expenditures by Wilderness VisitorsLocation <strong>of</strong> Study Expenditures /person / dayMontana wilderness (backpacking) $39.10Montana wilderness (fishing) $42.83Montana wilderness (nature study) $35.06Utah wilderness (Box Death Canyon) $38.44Utah wilderness (Dark Canyon) $47.02Utah wilderness (Gr<strong>and</strong> Gulch) $37.66Utah wilderness (Paria Canyon) $36.16Average $39.47Table 41. Average Expenditures <strong>of</strong> Wilderness Visitors by Category <strong>of</strong> PurchaseIndustry Average Expenditures /person / dayGasoline $ 8.22Groceries $ 8.23Restaurant/Bar $ 6.78Lodging <strong>and</strong> Campground $ 6.47Auto/RV Rental $ 1.56Licenses/Admissions $ 1.14Recreation Equipment / Outfitter / Guide $ 1.59Retail $ 5.48Total $39.4771
A study <strong>of</strong> visitors to Rio Gr<strong>and</strong>e National Forest (52% <strong>of</strong> whom listed hiking as theirprimary activity) estimated that each individual spent $567.93 for lodging, $319.44 forfood <strong>and</strong> drink, <strong>and</strong> $168.44 for transportation per visit. This spending was done withina 50 mile radius <strong>of</strong> the recreation site (USDA Forest Service, 2001).Table 42. Average per person national forest trip expenditures on the Rio Gr<strong>and</strong>eNational ForestExpenditure CategoryAverage expenditureGovernment owned lodging $1Privately owned lodging $567Food/drink at restaurants <strong>and</strong> bars $122Other food <strong>and</strong> beverages $197Gasoline <strong>and</strong> oil $159Other transportation (plane, bus, etc.) $9Activities (including guide fees <strong>and</strong> equipment rental) $23Entry, parking, or recreation use fees $4Souvenirs/ clothing $34Any other expenses $21<strong>Economic</strong> modeling <strong>of</strong> wildl<strong>and</strong>s in the Eastern Sierra Nevada region (5.5 million acresunder management by the Forest Service, Bureau <strong>of</strong> L<strong>and</strong> Management, <strong>and</strong> NationalPark Service in Mono <strong>and</strong> Inyo Counties <strong>of</strong> California) shows that visitors support2,812 jobs (15.0% <strong>of</strong> total jobs), $98.1 million in total income (11.9%), <strong>and</strong> $131.2million in output (10.6%) for the two-county region (Richardson, 2002).Table 43. Impact <strong>of</strong> Counties in Eastern Sierra Nevada regionRegional Impact Mono County Inyo County Region TotalEmployment Impact 1,511 jobs 1,300 jobs 2,812 jobsTotal Employment 8,663 jobs 10,032 jobs 18,695 jobs% <strong>of</strong> Total 17.4% 13.0% 15.0%Income Impact $ 51.8 million $ 46.3 million $ 98.1 millionTotal Income $393.9 million $427.2 million $ 821.1 million% <strong>of</strong> Total 13.1% 10.8% 11.9%Output Impact $ 69.4 million $ 61.8 million $ 131.2 millionTotal Output $585.1 million $654.7 million $1,239.8 million% <strong>of</strong> Total 11.9% 9.4% 10.6%A small survey conducted by California Trout during the summer <strong>of</strong> 2002 indicated tripexpenditures for the 17 anglers in the Golden Trout Wilderness (near Inyo NationalForest trailheads in California) totaled $7,085 <strong>and</strong> averaged $109 per day during anaverage four-day stay. The majority <strong>of</strong> trip-related expenditures, such as food <strong>and</strong>lodging, were local <strong>and</strong> most <strong>of</strong> the visitors came from other parts <strong>of</strong> California (Alkire,72
- Page 1:
ECONOMIC IMPACTS OF PARKS, RIVERS,
- Page 4 and 5:
AcknowledgementsI am grateful to ma
- Page 6 and 7:
3.5.5 Sources of Information.......
- Page 8 and 9:
Table 28. Hiking/Walking Organizati
- Page 10 and 11:
1 IntroductionParks, rivers, trails
- Page 12 and 13:
Table 1.SectionAgency ExpendituresC
- Page 14 and 15:
provide communities with economic,
- Page 16 and 17:
the most current information on the
- Page 18 and 19:
3.1 Agency ExpendituresThis section
- Page 20 and 21:
grants. About 25% of capital expend
- Page 22 and 23:
The Marin Conservation Corps (MCC)
- Page 24 and 25:
already been implemented and is ope
- Page 26 and 27:
Table 5.Net Benefit Per Participant
- Page 28 and 29:
WEST VIRGINIAWISCONSINEarthCorpsFed
- Page 30 and 31: contracts that gross over $800 mill
- Page 32 and 33: 3.2.2 Special EventsRevenue enhanci
- Page 34 and 35: park experience to an audience who
- Page 36 and 37: you have the opportunity to determi
- Page 38 and 39: Use good survey methods. The better
- Page 40 and 41: California. A Report to The Sierra
- Page 42 and 43: powered activities 3 , a participan
- Page 44 and 45: Table 11. 2003 Sport Footwear Purch
- Page 46 and 47: 3.3.4 Fish and Wildlife-Related Rec
- Page 48 and 49: EQUIPMENT AND OTHER EXPENSESTotal $
- Page 50 and 51: Table 17. Estimates of Retail Expen
- Page 52 and 53: Table 19. U.S. Ski & Snowboard Indu
- Page 54 and 55: and from services related to the Pa
- Page 56 and 57: o $60 million in Harris County, TX,
- Page 58 and 59: League ofAmericanBicyclistsNational
- Page 60 and 61: SportingGoodsManufacturersAssociati
- Page 62 and 63: necessarily better, especially in s
- Page 64 and 65: Perspective. Available at http://ww
- Page 66 and 67: o Washington: $209 milliono West Vi
- Page 68 and 69: Economic Output Retail Sales Salari
- Page 70 and 71: Economic Output Retail Sales Salari
- Page 72 and 73: Table 35. Economic Impact of Sportf
- Page 74 and 75: All Anglers Non-Resident/Tourist An
- Page 76 and 77: Table 37. Per Capita Travel Receipt
- Page 78 and 79: their decision to return in the fut
- Page 82 and 83: 2003). Data from California Departm
- Page 84 and 85: over 2003, despite high gas prices,
- Page 86 and 87: management changes or actions are e
- Page 88 and 89: accommodations used, and other trip
- Page 90 and 91: http://www.ncdot.org/transit/bicycl
- Page 92 and 93: 3.5 Estimating the Effects of Spend
- Page 94 and 95: “leakage” of money from the reg
- Page 96 and 97: Keep in mind that multipliers are s
- Page 98 and 99: 3.5.4 How to Use These Rationales i
- Page 100 and 101: economy, only those expenditures th
- Page 102 and 103: For example, be aware of the differ
- Page 104 and 105: 3.6 Health Care and FitnessThis sec
- Page 106 and 107: active, approximately $575 million
- Page 108 and 109: already had one heart attacko Impro
- Page 110 and 111: uilt as part of sound policy to pro
- Page 112 and 113: accounting for 14 million disabilit
- Page 114 and 115: park amenities available or do not
- Page 116 and 117: National Coalitionfor PromotingPhys
- Page 118 and 119: 100% of all health benefits to a si
- Page 120 and 121: Pratt M, Macera CA, Wang G. 2000. H
- Page 122 and 123: costs than normal weight; moderate
- Page 124 and 125: References for Additional Informati
- Page 126 and 127: 3.7 Benefit EstimationParks, rivers
- Page 128 and 129: Table 47.Forecasted Average Benefit
- Page 130 and 131:
Table 48.CriteriaRecreationExperien
- Page 132 and 133:
people using carefully designed and
- Page 134 and 135:
special government funds for causes
- Page 136 and 137:
Loomis, J. B., and White, D.S. 1996
- Page 138 and 139:
Economic Assessment for the Necedah
- Page 140 and 141:
Commercial UsesExpenditures byResid
- Page 142 and 143:
Outcomes Expenditures by GGNRA mana
- Page 144 and 145:
local transportation admissions and
- Page 146 and 147:
3.8.8 Educational ValueWhile it may
- Page 148 and 149:
the same municipality that are furt
- Page 150 and 151:
that do require storm water managem
- Page 152 and 153:
Summary of ActionsSimilar to corpor
- Page 154 and 155:
3.9 Resource Book AppendicesSeveral
- Page 156 and 157:
6. Spending in the area. Please rep
- Page 158 and 159:
local economy aren’t bringing in
- Page 160 and 161:
4 ConclusionIn 1995, the National P