o Washington: $209 milliono West Virginia: $73 milliono Wisconsin: $263 milliono Wyoming: $24 millionAnnual Expenditures on merch<strong>and</strong>ise (outdoor gear, apparel, footwear) by region (OIF,2002):o West: $2.9 billiono North Central: $3.4 billiono Northeast: $2.0 billiono South Central: $4.9 billion Average amount spent annually on outdoor activities by age group (OIF, 2002):o 16-24: $540o 25-34: $863o 35-44: $928o 45+: $82257
Table 32. <strong>Economic</strong> Impact <strong>of</strong> Sportfishing by State for 2001<strong>Economic</strong> Output Retail Sales Salaries <strong>and</strong>WagesJobs Sales <strong>and</strong>Motor FuelTaxesState IncomeTaxesFederal IncomeTaxesAlabama $1,676,108,986 $858,124,876 $412,447,847 19,467 $43,660,478 $16,729,004 $42,448,901Alaska $959,821,921 $587,028,597 $238,011,311 11,064 $2,785,026 No Tax $24,665,604Arizona $844,638,887 $446,416,439 $216,362,618 8,478 $25,605,136 $5,142,988 $35,548,103Arkansas $843,349,209 $471,099,603 $210,183,369 10,009 $27,534,616 $10,208,912 $21,543,819California $4,899,389,802 $2,388,562,665 $1,285,643,099 43,130 $163,348,768 $61,818,827 $231,709,736Colorado $1,579,687,512 $790,901,984 $413,856,808 15,253 $32,011,239 $13,434,236 $70,720,789Connecticut $389,375,629 $224,198,630 $94,948,732 3,097 $15,059,935 $2,879,110 $17,362,296Delaware $112,253,889 $70,029,106 $22,904,413 1,036 $1,348,021 $840,911 $2,402,398Florida $7,455,766,835 $4,117,176,994 $1,994,632,271 79,949 $227,212,765 No Tax $322,666,622Georgia $1,140,197,359 $568,712,185 $283,998,584 10,649 $19,453,652 $15,123,091 $48,016,130Hawaii $186,562,268 $107,906,440 $49,796,556 2,095 $5,170,991 $3,453,889 $7,774,762Idaho $681,065,982 $409,453,451 $157,402,757 7,773 $22,889,647 $6,846,807 $15,856,844Illinois $1,623,449,163 $736,575,125 $398,275,277 12,886 $50,445,665 $9,377,569 $73,123,710Indiana $1,113,114,874 $538,729,555 $280,477,686 11,171 $27,166,764 $7,010,563 $45,574,350Iowa $741,050,479 $362,542,553 $167,146,947 7,119 $21,199,312 $9,156,477 $25,853,206Kansas $403,200,176 $205,141,349 $94,633,538 4,226 $12,817,515 $4,329,705 $14,084,709Kentucky $1,299,964,305 $671,707,079 $290,656,549 13,268 $39,806,964 $16,086,082 $42,449,138Louisiana $1,535,277,920 $842,362,796 $371,864,510 15,993 $46,771,991 $9,116,979 $57,081,560Maine $541,188,350 $322,122,047 $129,380,734 6,109 $16,702,617 $7,180,670 $13,313,231Maryl<strong>and</strong> $1,063,396,570 $557,544,005 $270,916,901 11,020 $31,348,481 $10,012,837 $43,370,816Massachusetts $888,486,177 $494,165,471 $225,328,262 8,169 $29,055,826 $10,605,484 $38,887,196Michigan $2,173,318,216 $1,139,130,590 $553,768,441 21,301 $70,897,258 $14,714,425 $92,110,866Minnesota $2,862,561,056 $1,460,636,605 $713,190,334 28,421 $102,379,875 $24,886,332 $115,838,653Mississippi $463,103,315 $239,212,966 $110,060,719 5,020 $18,860,467 $3,971,979 $11,501,798Missouri $1,621,784,787 $832,776,355 $362,817,536 14,889 $40,800,571 $14,131,111 $57,714,034Montana $544,795,715 $318,535,459 $136,106,672 7,029 $7,087,276 $5,601,108 $13,404,645Nebraska $339,682,059 $187,235,156 $82,706,084 3,798 $11,116,714 $3,365,147 $8,617,54858
- Page 1:
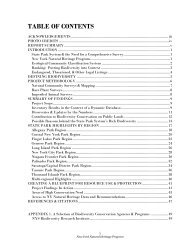
ECONOMIC IMPACTS OF PARKS, RIVERS,
- Page 4 and 5:
AcknowledgementsI am grateful to ma
- Page 6 and 7:
3.5.5 Sources of Information.......
- Page 8 and 9:
Table 28. Hiking/Walking Organizati
- Page 10 and 11:
1 IntroductionParks, rivers, trails
- Page 12 and 13:
Table 1.SectionAgency ExpendituresC
- Page 14 and 15:
provide communities with economic,
- Page 16 and 17: the most current information on the
- Page 18 and 19: 3.1 Agency ExpendituresThis section
- Page 20 and 21: grants. About 25% of capital expend
- Page 22 and 23: The Marin Conservation Corps (MCC)
- Page 24 and 25: already been implemented and is ope
- Page 26 and 27: Table 5.Net Benefit Per Participant
- Page 28 and 29: WEST VIRGINIAWISCONSINEarthCorpsFed
- Page 30 and 31: contracts that gross over $800 mill
- Page 32 and 33: 3.2.2 Special EventsRevenue enhanci
- Page 34 and 35: park experience to an audience who
- Page 36 and 37: you have the opportunity to determi
- Page 38 and 39: Use good survey methods. The better
- Page 40 and 41: California. A Report to The Sierra
- Page 42 and 43: powered activities 3 , a participan
- Page 44 and 45: Table 11. 2003 Sport Footwear Purch
- Page 46 and 47: 3.3.4 Fish and Wildlife-Related Rec
- Page 48 and 49: EQUIPMENT AND OTHER EXPENSESTotal $
- Page 50 and 51: Table 17. Estimates of Retail Expen
- Page 52 and 53: Table 19. U.S. Ski & Snowboard Indu
- Page 54 and 55: and from services related to the Pa
- Page 56 and 57: o $60 million in Harris County, TX,
- Page 58 and 59: League ofAmericanBicyclistsNational
- Page 60 and 61: SportingGoodsManufacturersAssociati
- Page 62 and 63: necessarily better, especially in s
- Page 64 and 65: Perspective. Available at http://ww
- Page 68 and 69: Economic Output Retail Sales Salari
- Page 70 and 71: Economic Output Retail Sales Salari
- Page 72 and 73: Table 35. Economic Impact of Sportf
- Page 74 and 75: All Anglers Non-Resident/Tourist An
- Page 76 and 77: Table 37. Per Capita Travel Receipt
- Page 78 and 79: their decision to return in the fut
- Page 80 and 81: Table 39. Visitors and Spending in
- Page 82 and 83: 2003). Data from California Departm
- Page 84 and 85: over 2003, despite high gas prices,
- Page 86 and 87: management changes or actions are e
- Page 88 and 89: accommodations used, and other trip
- Page 90 and 91: http://www.ncdot.org/transit/bicycl
- Page 92 and 93: 3.5 Estimating the Effects of Spend
- Page 94 and 95: “leakage” of money from the reg
- Page 96 and 97: Keep in mind that multipliers are s
- Page 98 and 99: 3.5.4 How to Use These Rationales i
- Page 100 and 101: economy, only those expenditures th
- Page 102 and 103: For example, be aware of the differ
- Page 104 and 105: 3.6 Health Care and FitnessThis sec
- Page 106 and 107: active, approximately $575 million
- Page 108 and 109: already had one heart attacko Impro
- Page 110 and 111: uilt as part of sound policy to pro
- Page 112 and 113: accounting for 14 million disabilit
- Page 114 and 115: park amenities available or do not
- Page 116 and 117:
National Coalitionfor PromotingPhys
- Page 118 and 119:
100% of all health benefits to a si
- Page 120 and 121:
Pratt M, Macera CA, Wang G. 2000. H
- Page 122 and 123:
costs than normal weight; moderate
- Page 124 and 125:
References for Additional Informati
- Page 126 and 127:
3.7 Benefit EstimationParks, rivers
- Page 128 and 129:
Table 47.Forecasted Average Benefit
- Page 130 and 131:
Table 48.CriteriaRecreationExperien
- Page 132 and 133:
people using carefully designed and
- Page 134 and 135:
special government funds for causes
- Page 136 and 137:
Loomis, J. B., and White, D.S. 1996
- Page 138 and 139:
Economic Assessment for the Necedah
- Page 140 and 141:
Commercial UsesExpenditures byResid
- Page 142 and 143:
Outcomes Expenditures by GGNRA mana
- Page 144 and 145:
local transportation admissions and
- Page 146 and 147:
3.8.8 Educational ValueWhile it may
- Page 148 and 149:
the same municipality that are furt
- Page 150 and 151:
that do require storm water managem
- Page 152 and 153:
Summary of ActionsSimilar to corpor
- Page 154 and 155:
3.9 Resource Book AppendicesSeveral
- Page 156 and 157:
6. Spending in the area. Please rep
- Page 158 and 159:
local economy aren’t bringing in
- Page 160 and 161:
4 ConclusionIn 1995, the National P