Economic Impacts of Parks, Rivers, Trails and Greenways
Economic Impacts of Parks, Rivers, Trails and Greenways
Economic Impacts of Parks, Rivers, Trails and Greenways

Create successful ePaper yourself
Turn your PDF publications into a flip-book with our unique Google optimized e-Paper software.
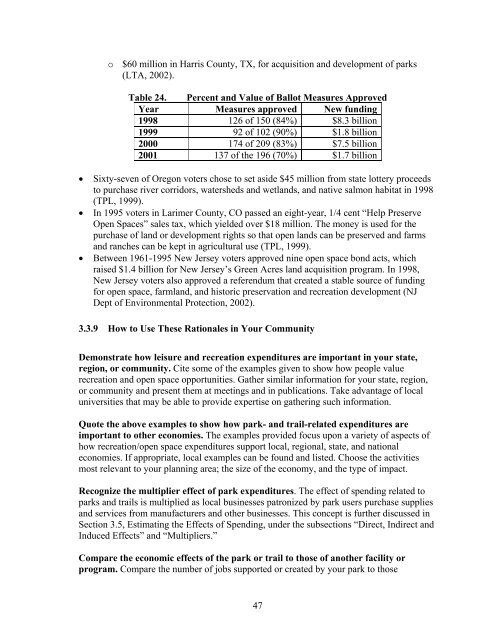
o $60 million in Harris County, TX, for acquisition <strong>and</strong> development <strong>of</strong> parks(LTA, 2002).Table 24. Percent <strong>and</strong> Value <strong>of</strong> Ballot Measures ApprovedYear Measures approved New funding1998 126 <strong>of</strong> 150 (84%) $8.3 billion1999 92 <strong>of</strong> 102 (90%) $1.8 billion2000 174 <strong>of</strong> 209 (83%) $7.5 billion2001 137 <strong>of</strong> the 196 (70%) $1.7 billionSixty-seven <strong>of</strong> Oregon voters chose to set aside $45 million from state lottery proceedsto purchase river corridors, watersheds <strong>and</strong> wetl<strong>and</strong>s, <strong>and</strong> native salmon habitat in 1998(TPL, 1999).In 1995 voters in Larimer County, CO passed an eight-year, 1/4 cent “Help PreserveOpen Spaces” sales tax, which yielded over $18 million. The money is used for thepurchase <strong>of</strong> l<strong>and</strong> or development rights so that open l<strong>and</strong>s can be preserved <strong>and</strong> farms<strong>and</strong> ranches can be kept in agricultural use (TPL, 1999).Between 1961-1995 New Jersey voters approved nine open space bond acts, whichraised $1.4 billion for New Jersey’s Green Acres l<strong>and</strong> acquisition program. In 1998,New Jersey voters also approved a referendum that created a stable source <strong>of</strong> fundingfor open space, farml<strong>and</strong>, <strong>and</strong> historic preservation <strong>and</strong> recreation development (NJDept <strong>of</strong> Environmental Protection, 2002).3.3.9 How to Use These Rationales in Your CommunityDemonstrate how leisure <strong>and</strong> recreation expenditures are important in your state,region, or community. Cite some <strong>of</strong> the examples given to show how people valuerecreation <strong>and</strong> open space opportunities. Gather similar information for your state, region,or community <strong>and</strong> present them at meetings <strong>and</strong> in publications. Take advantage <strong>of</strong> localuniversities that may be able to provide expertise on gathering such information.Quote the above examples to show how park- <strong>and</strong> trail-related expenditures areimportant to other economies. The examples provided focus upon a variety <strong>of</strong> aspects <strong>of</strong>how recreation/open space expenditures support local, regional, state, <strong>and</strong> nationaleconomies. If appropriate, local examples can be found <strong>and</strong> listed. Choose the activitiesmost relevant to your planning area; the size <strong>of</strong> the economy, <strong>and</strong> the type <strong>of</strong> impact.Recognize the multiplier effect <strong>of</strong> park expenditures. The effect <strong>of</strong> spending related toparks <strong>and</strong> trails is multiplied as local businesses patronized by park users purchase supplies<strong>and</strong> services from manufacturers <strong>and</strong> other businesses. This concept is further discussed inSection 3.5, Estimating the Effects <strong>of</strong> Spending, under the subsections “Direct, Indirect <strong>and</strong>Induced Effects” <strong>and</strong> “Multipliers.”Compare the economic effects <strong>of</strong> the park or trail to those <strong>of</strong> another facility orprogram. Compare the number <strong>of</strong> jobs supported or created by your park to those47