in a Dynamic Environment - Domain-b
in a Dynamic Environment - Domain-b
in a Dynamic Environment - Domain-b
- No tags were found...

You also want an ePaper? Increase the reach of your titles
YUMPU automatically turns print PDFs into web optimized ePapers that Google loves.
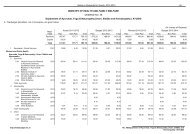
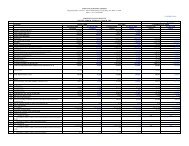
Annual Report 2008-09The chart below is an analysis of the market for the areasof <strong>in</strong>terest to the Company based on the NASSCOMStrategic Review 2009.Chart 8: Trend of outsourc<strong>in</strong>g <strong>in</strong> global technologyspend<strong>in</strong>g - area of <strong>in</strong>terestAmount <strong>in</strong> USD BillionServices/Year CY 2008 CY 2012 CAGR (%)IT Outsourc<strong>in</strong>g 211 275 6.9BPO 115 181 11.9Total 326 456 8.8Nasscom says the IT Outsourc<strong>in</strong>g/BPO sub-segment isexpected to grow at a CAGR of 8.8% till FY 2012Chart 9, 10 and 11 highlight spend<strong>in</strong>g trends across varioussub-segments <strong>in</strong> IT services and BPO market.Chart 9: Trends <strong>in</strong> IT Services Related Spend<strong>in</strong>gAmount <strong>in</strong> USD BillionWorldwide IT services related spend<strong>in</strong>gServices/Year CY 2008 CY 2012 CAGR (%)Project Based 196 231 4.1Outsourc<strong>in</strong>g 211 275 6.9Support /Tra<strong>in</strong><strong>in</strong>g 149 166 2.6IT Services 556 672 4.8Chart 11: Trends <strong>in</strong> vertical IT services spend<strong>in</strong>gIndustry vertical CY 2008 CY 2012 CAGR (%)Bank<strong>in</strong>g, F<strong>in</strong>ancialservices, Insurance 256 298 3.9Manufactur<strong>in</strong>g 240 295 5.3Retail 137 163 4.4Services 109 129 4.3Healthcare 33 41 5.6Transportation 39 46 4.2Communication 185 217 4.1Utilities &Construction 59 72 5.1Government 169 210 5.6Source: NASSCOM Strategic Review 2009Only market siz<strong>in</strong>g and growth prospects of select verticalsof <strong>in</strong>terest to the Company are shown <strong>in</strong> chart 11.Growth of Indian <strong>in</strong>formation technology <strong>in</strong>dustryChart 12: Trends <strong>in</strong> Indian IT servicesSource: NASSCOM Strategic Review 2009Chart 10: Trends <strong>in</strong> BPO Services spend<strong>in</strong>gAmount <strong>in</strong> USD BillionWorldwide BPO related spend<strong>in</strong>gServices/Year CY 2008 CY 2012 CAGR (%)Customer care 62 97 11.9F<strong>in</strong>ance and Accounts 26 40 11.3Human Resources 18 29 12.5Tra<strong>in</strong><strong>in</strong>g 7 11 10.8Procurement 2 4 19.5BPO Services 115 181 11.9Source: NASSCOM Strategic Review 2009The growth <strong>in</strong> BPO spends and BPO outsourc<strong>in</strong>g spends isexpected to cont<strong>in</strong>ue. (Chart 10)Source: NASSCOM Strategic Review 2009With estimated revenues of USD 71.6 billion <strong>in</strong> fiscal 2009(Growth of 12.0%), the IT-BPO <strong>in</strong>dustry cont<strong>in</strong>ues to growat a CAGR of 27.1% s<strong>in</strong>ce FY 2004. The India-Centric ITbus<strong>in</strong>ess growth <strong>in</strong> FY 2009 has slowed down to 12.0%from 33.0% <strong>in</strong> FY 2008.50