in a Dynamic Environment - Domain-b
in a Dynamic Environment - Domain-b
in a Dynamic Environment - Domain-b
- No tags were found...

You also want an ePaper? Increase the reach of your titles
YUMPU automatically turns print PDFs into web optimized ePapers that Google loves.
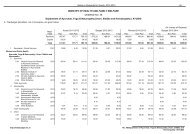
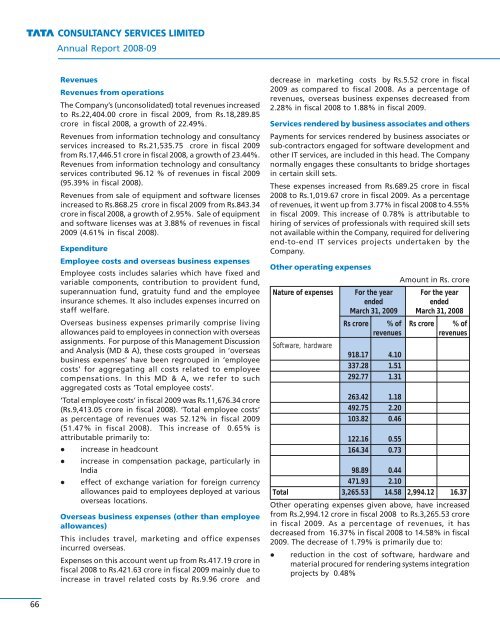
Annual Report 2008-09RevenuesRevenues from operationsThe Company’s (unconsolidated) total revenues <strong>in</strong>creasedto Rs.22,404.00 crore <strong>in</strong> fiscal 2009, from Rs.18,289.85crore <strong>in</strong> fiscal 2008, a growth of 22.49%.Revenues from <strong>in</strong>formation technology and consultancyservices <strong>in</strong>creased to Rs.21,535.75 crore <strong>in</strong> fiscal 2009from Rs.17,446.51 crore <strong>in</strong> fiscal 2008, a growth of 23.44%.Revenues from <strong>in</strong>formation technology and consultancyservices contributed 96.12 % of revenues <strong>in</strong> fiscal 2009(95.39% <strong>in</strong> fiscal 2008).Revenues from sale of equipment and software licenses<strong>in</strong>creased to Rs.868.25 crore <strong>in</strong> fiscal 2009 from Rs.843.34crore <strong>in</strong> fiscal 2008, a growth of 2.95%. Sale of equipmentand software licenses was at 3.88% of revenues <strong>in</strong> fiscal2009 (4.61% <strong>in</strong> fiscal 2008).ExpenditureEmployee costs and overseas bus<strong>in</strong>ess expensesEmployee costs <strong>in</strong>cludes salaries which have fixed andvariable components, contribution to provident fund,superannuation fund, gratuity fund and the employee<strong>in</strong>surance schemes. It also <strong>in</strong>cludes expenses <strong>in</strong>curred onstaff welfare.Overseas bus<strong>in</strong>ess expenses primarily comprise liv<strong>in</strong>gallowances paid to employees <strong>in</strong> connection with overseasassignments. For purpose of this Management Discussionand Analysis (MD & A), these costs grouped <strong>in</strong> ‘overseasbus<strong>in</strong>ess expenses’ have been regrouped <strong>in</strong> ‘employeecosts’ for aggregat<strong>in</strong>g all costs related to employeecompensations. In this MD & A, we refer to suchaggregated costs as ‘Total employee costs’.‘Total employee costs’ <strong>in</strong> fiscal 2009 was Rs.11,676.34 crore(Rs.9,413.05 crore <strong>in</strong> fiscal 2008). ‘Total employee costs’as percentage of revenues was 52.12% <strong>in</strong> fiscal 2009(51.47% <strong>in</strong> fiscal 2008). This <strong>in</strong>crease of 0.65% isattributable primarily to: <strong>in</strong>crease <strong>in</strong> headcount <strong>in</strong>crease <strong>in</strong> compensation package, particularly <strong>in</strong>India effect of exchange variation for foreign currencyallowances paid to employees deployed at variousoverseas locations.Overseas bus<strong>in</strong>ess expenses (other than employeeallowances)This <strong>in</strong>cludes travel, market<strong>in</strong>g and office expenses<strong>in</strong>curred overseas.Expenses on this account went up from Rs.417.19 crore <strong>in</strong>fiscal 2008 to Rs.421.63 crore <strong>in</strong> fiscal 2009 ma<strong>in</strong>ly due to<strong>in</strong>crease <strong>in</strong> travel related costs by Rs.9.96 crore anddecrease <strong>in</strong> market<strong>in</strong>g costs by Rs.5.52 crore <strong>in</strong> fiscal2009 as compared to fiscal 2008. As a percentage ofrevenues, overseas bus<strong>in</strong>ess expenses decreased from2.28% <strong>in</strong> fiscal 2008 to 1.88% <strong>in</strong> fiscal 2009.Services rendered by bus<strong>in</strong>ess associates and othersPayments for services rendered by bus<strong>in</strong>ess associates orsub-contractors engaged for software development andother IT services, are <strong>in</strong>cluded <strong>in</strong> this head. The Companynormally engages these consultants to bridge shortages<strong>in</strong> certa<strong>in</strong> skill sets.These expenses <strong>in</strong>creased from Rs.689.25 crore <strong>in</strong> fiscal2008 to Rs.1,019.67 crore <strong>in</strong> fiscal 2009. As a percentageof revenues, it went up from 3.77% <strong>in</strong> fiscal 2008 to 4.55%<strong>in</strong> fiscal 2009. This <strong>in</strong>crease of 0.78% is attributable tohir<strong>in</strong>g of services of professionals with required skill setsnot available with<strong>in</strong> the Company, required for deliver<strong>in</strong>gend-to-end IT services projects undertaken by theCompany.Other operat<strong>in</strong>g expensesAmount <strong>in</strong> Rs. croreNature of expenses For the year For the yearendedendedMarch 31, 2009 March 31, 2008Rs crore % of Rs crore % ofrevenues revenuesSoftware, hardware918.17 4.10337.28 1.51292.77 1.31263.42 1.18492.75 2.20103.82 0.46122.16 0.55164.34 0.7398.89 0.44471.93 2.10Total 3,265.53 14.58 2,994.12 16.37Other operat<strong>in</strong>g expenses given above, have <strong>in</strong>creasedfrom Rs.2,994.12 crore <strong>in</strong> fiscal 2008 to Rs.3,265.53 crore<strong>in</strong> fiscal 2009. As a percentage of revenues, it hasdecreased from 16.37% <strong>in</strong> fiscal 2008 to 14.58% <strong>in</strong> fiscal2009. The decrease of 1.79% is primarily due to: reduction <strong>in</strong> the cost of software, hardware andmaterial procured for render<strong>in</strong>g systems <strong>in</strong>tegrationprojects by 0.48%66