Annual Report 2008-09FINANCIAL PERFORMANCEOVERVIEW - EXECUTIVE SUMMARYThe f<strong>in</strong>ancial performance of Tata Consultancy ServicesLimited (TCS Limited) as per Indian GAAP is discussedhereunder <strong>in</strong> two parts:(i) Tata Consultancy Services Limited (Unconsolidated)which excludes the performance of subsidiaries ofTCS Limited.(ii) Tata Consultancy Services Limited (Consolidated)which <strong>in</strong>cludes performance of subsidiaries of TCSLimited. The Consolidated F<strong>in</strong>ancial Statementsbr<strong>in</strong>g out comprehensively the performance of theTCS group of companies and are more relevant forunderstand<strong>in</strong>g the overall performance of the TCSgroup.The f<strong>in</strong>ancial statements are prepared <strong>in</strong> compliance withthe Companies Act, 1956 and generally acceptedaccount<strong>in</strong>g pr<strong>in</strong>ciples <strong>in</strong> India.F<strong>in</strong>ancial performance summary (unconsolidated)The total revenues of TCS Limited aggregatedRs.22,404.00 crore <strong>in</strong> fiscal 2009 as compared toRs.18,289.85 crore <strong>in</strong> fiscal 2008, register<strong>in</strong>g a growth of22.49%.In fiscal 2009, the Company's profit before taxesaggregated Rs.5,139.69 crore (Rs.5,003.86 crore <strong>in</strong> fiscal2008).In fiscal 2009, the Company's profit after taxesaggregated Rs.4,696.21 crore (Rs.4,508.76 crore <strong>in</strong> fiscal2008).In fiscal 2009, the Company's earn<strong>in</strong>gs per share wereRs.47.91 (Rs.46.07 <strong>in</strong> fiscal 2008).F<strong>in</strong>ancial performance summary (consolidated)In fiscal 2009, the total consolidated revenues of TCSLimited aggregated Rs.27,812.88 crore as compared toRs.22,619.52 crore <strong>in</strong> fiscal 2008, register<strong>in</strong>g a growth of22.96%.The consolidated profit before taxes aggregatedRs.6,150.07 crore <strong>in</strong> fiscal 2009 (Rs.5,845.95 crore <strong>in</strong> fiscal2008).In fiscal 2009, the Company's consolidated profit aftertaxes aggregated Rs.5,256.42 crore (Rs.5,026.02 crore <strong>in</strong>fiscal 2008).In fiscal 2009, the Company's consolidated earn<strong>in</strong>gs pershare were Rs.53.63 (Rs.51.36 <strong>in</strong> fiscal 2008).Dividends declared and proposed bonus issueFor fiscal 2009 the Company declared three <strong>in</strong>terimdividends of Rs.3 each on the equity shares. A f<strong>in</strong>aldividend of Rs.5 per equity share has been recommended.On approval of the f<strong>in</strong>al dividend, total dividend for fiscal2009 would be Rs.14 per equity share. The total outflowon dividend would stand at 34.13% of the profits of theCompany. Complete details of the dividend paid areavailable <strong>in</strong> the director’s report. On preference shares adividend of 7% has been proposed.The Directors have recommended issue of bonus shares<strong>in</strong> the ratio of 1:1 subject to the approval of theshareholders.64
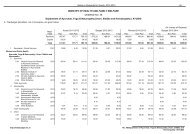
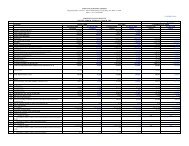
TCS LIMITED (UNCONSOLIDATED)RESULTS OF OPERATIONS - TCS LIMITED (UNCONSOLIDATED)The Management’s Discussion and Analysis given below relates to the audited f<strong>in</strong>ancial statements of TCS Limited(Unconsolidated). The discussion should be read <strong>in</strong> conjunction with the f<strong>in</strong>ancial statements and related notes for theyear ended March 31, 2009.The follow<strong>in</strong>g table gives an overview of the f<strong>in</strong>ancial results of TCS Limited (unconsolidated):Amount <strong>in</strong> Rs. croreFor the year ended For the year endedParticulars March 31, 2009 March 31, 2008 % Increase/Revenue from operations Rs. crore % of Rs. crore % of(decrease)revenuesrevenuesInformation technology and consultancy services 21,535.75 96.12 17,446.51 95.39 23.44Sale of equipment and software licences 868.25 3.88 843.34 4.61 2.95Total revenues 22,404.00 100.00 18,289.85 100.00 22.49Expenditure:Employee costs 7,370.09 32.90 5,961.17 32.59 23.63Overseas bus<strong>in</strong>ess expenses (employeeallowance paid overseas) 4,306.25 19.22 3,451.88 18.87 24.75Total employee costs 11,676.34 52.12 9,413.05 51.47 24.04Overseas bus<strong>in</strong>ess expenses (other thanemployee allowance paid overseas) 421.63 1.88 417.19 2.28 1.06Services rendered by bus<strong>in</strong>ess associates andothers 1,019.67 4.55 689.25 3.77 47.94Other operat<strong>in</strong>g expenses 3,265.53 14.58 2,994.12 16.37 9.06Total expenditure 16,383.17 73.13 13,513.61 73.89 21.23Other <strong>in</strong>come (net) (456.24) (2.04) 689.82 3.77 -Profit before <strong>in</strong>terest, depreciation andtaxes 5,564.59 24.84 5,466.06 29.89 1.80Interest 7.44 0.03 3.42 0.02 117.54Depreciation 417.46 1.86 458.78 2.51 (9.01)Profit before taxes 5,139.69 22.94 5,003.86 27.36 2.71Provision for taxes:Income tax expense (<strong>in</strong>clud<strong>in</strong>g deferred taxbenefit and MAT credit entitlement) 420.48 1.88 470.45 2.57 (10.62)Fr<strong>in</strong>ge benefit tax 23.00 0.10 24.65 0.13 (6.69)Net profit for the year 4,696.21 20.96 4,508.76 24.65 4.1665