Annual Report 2008-09Rs.6,150.07 crore (Rs.5,845.95 crore <strong>in</strong> fiscal 2008), thenet cash generated <strong>in</strong>cludes adjustments for non-cashitems like depreciation of Rs.564.08 crore(Rs.563.71 crore <strong>in</strong> fiscal 2008).Other significant items contribut<strong>in</strong>g <strong>in</strong> generation/use ofcash from operat<strong>in</strong>g activities relat<strong>in</strong>g to work<strong>in</strong>g capitalare given <strong>in</strong> the table below:Amount <strong>in</strong> Rs. croreParticulars Fiscal Fiscal Increase/2009 2008 (decrease)Adjustments for:5.83(64.73)(513.61)(222.49)402.17525.33Effect of work<strong>in</strong>gcapital changes 132.50 (1,327.98) 1,460.48Cash Flow from <strong>in</strong>vest<strong>in</strong>g activitiesAmount <strong>in</strong> Rs. croreParticulars Fiscal Fiscal Increase/2009 2008 (decrease)(1,108.81)1,150.34(2,445.29)The significant items <strong>in</strong> <strong>in</strong>vest<strong>in</strong>g activities <strong>in</strong> fiscal 2009were: cash used for the purchase of fixed assetsRs.1,108.81 crore (Rs.1,270.98 crore <strong>in</strong> fiscal 2008) cash generated from sale of other <strong>in</strong>vestments netof mutual fund dividend of Rs.1,150.34 crore <strong>in</strong> fiscal2009 (Rs.1,247.18 crore cash used <strong>in</strong> fiscal 2008 forpurchase of <strong>in</strong>vestments <strong>in</strong> mutual funds) cash used for the purchase of subsidiaries (primarilyCitigroup Global Services Limited acquisition) ofRs.2,445.29 crore <strong>in</strong> fiscal 2009 (Rs.156.84 crore <strong>in</strong>fiscal 2008) cash used for <strong>in</strong>vestments <strong>in</strong> fixed deposits ofmaturity greater than three monthsRs.1,114.53 crore <strong>in</strong> fiscal 2009 (Rs.99.38 crore cashgenerated <strong>in</strong> fiscal 2008 by encashment of fixeddeposits) other cash flows related to <strong>in</strong>vest<strong>in</strong>g activities suchas proceeds from sale of fixed assets, <strong>in</strong>tercorporatedeposits placed/refunded, dividendsreceived from subsidiaries and from other<strong>in</strong>vestments and <strong>in</strong>terest/grants received result<strong>in</strong>g<strong>in</strong> cash generation of Rs.85.38 crore <strong>in</strong> fiscal 2009(Rs.56.31 crore <strong>in</strong> fiscal 2008).Cash flow from f<strong>in</strong>anc<strong>in</strong>g activitiesAmount <strong>in</strong> Rs. croreParticulars Fiscal Fiscal Increase/2009 2008 (decrease)3.93(12.51)(1,606.07)(8.11)(1,114.53)85.38Net cash used for<strong>in</strong>vest<strong>in</strong>g activities (3,432.91) (2,519.31) (913.60)In fiscal 2009 the Company used Rs.3,432.91 crore on<strong>in</strong>vest<strong>in</strong>g activities (Rs.2,519.31 crore <strong>in</strong> fiscal 2008).(32.75)-Net cash used <strong>in</strong>f<strong>in</strong>anc<strong>in</strong>g activities (1,655.51) (1,441.70) (213.81)In fiscal 2009 the Company used Rs.1,655.51 crore onf<strong>in</strong>anc<strong>in</strong>g activities (Rs.1,441.70 crore <strong>in</strong> fiscal 2008).In fiscal 2009, the significant item of cash used <strong>in</strong> f<strong>in</strong>anc<strong>in</strong>gactivities was payment of dividend <strong>in</strong>clud<strong>in</strong>g taxRs.1,606.07 crore (Rs.1,490.29 crore <strong>in</strong> fiscal 2008).82
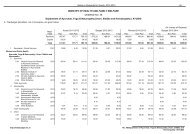
COMPANY'S CONSOLIDATED PERFORMANCE TREND ANALYSIS (INDIAN GAAP)Item Units FY 2008-09 FY 2007-08 FY 2006-07 FY 2005-06 FY 2004-05Total revenues Rs. crore 27,812.88 22,619.52 18,685.21 13,263.99 9,748.47International revenues Rs. crore 25,630.76 20,573.90 17,003.22 11,595.37 8,560.90International to total revenues % 92.15 90.96 91.00 87.50 87.82PBIDT Rs. crore 6,742.81 6,439.67 5,367.90 3,798.19 2,909.96PBIDT marg<strong>in</strong> % 24.24 28.47 28.73 28.66 29.85PAT Rs. crore 5,256.42 5,026.02 4,212.63 2,966.74 1,976.90PAT marg<strong>in</strong> % 18.90 22.22 22.55 22.37 20.28Earn<strong>in</strong>g per share (EPS) Rs. 53.63 51.36 43.05 30.32 20.20Headcount Number 143,761 111,407 89,419 66,480 45,715Revenue per associate Rs. ‘000 1,934.66 2,030.35 2,089.62 1,993.40 2,132.44Revenues from off-shorebus<strong>in</strong>ess % 44.20 41.90 40.50 37.40 38.70Revenues by geographicsegmentsAmericas % 56.09 54.79 56.27 59.04 59.20Europe % 29.53 29.19 28.47 22.43 23.08India % 7.85 9.04 9.00 12.49 12.18Others % 6.53 6.98 6.26 6.04 5.54Capital accounts FY 2008-09 FY 2007-08 FY 2006-07 FY 2005-06 FY 2004-05Share capital Rs. crore 197.86 197.86 97.86 48.93 48.01Reserves and surplus Rs. crore 15,502.15 12,102.26 8,752.24 5,949.88 3,429.53Gross block Rs. crore 5,843.86 4,291.80 3,197.71 1,951.04 1,170.65Total <strong>in</strong>vestments(for TCS unconsolidated) Rs. crore 5,936.03 4,509.33 3,252.04 1,963.52 1,404.42Net current assets Rs. crore 7,543.45 5,553.32 4,331.11 2,867.18 1,797.0983